
|
Amundi S.A. (AMUN.PA) DCF Valuation |
Fully Editable: Tailor To Your Needs In Excel Or Sheets
Professional Design: Trusted, Industry-Standard Templates
Investor-Approved Valuation Models
MAC/PC Compatible, Fully Unlocked
No Expertise Is Needed; Easy To Follow
Amundi S.A. (AMUN.PA) Bundle
Optimize your time and improve precision with our (AMUNPA) DCF Calculator! Utilizing real data from Amundi S.A. and customizable assumptions, this tool empowers you to forecast, analyze, and value Amundi S.A. like a seasoned investor.
What You Will Receive
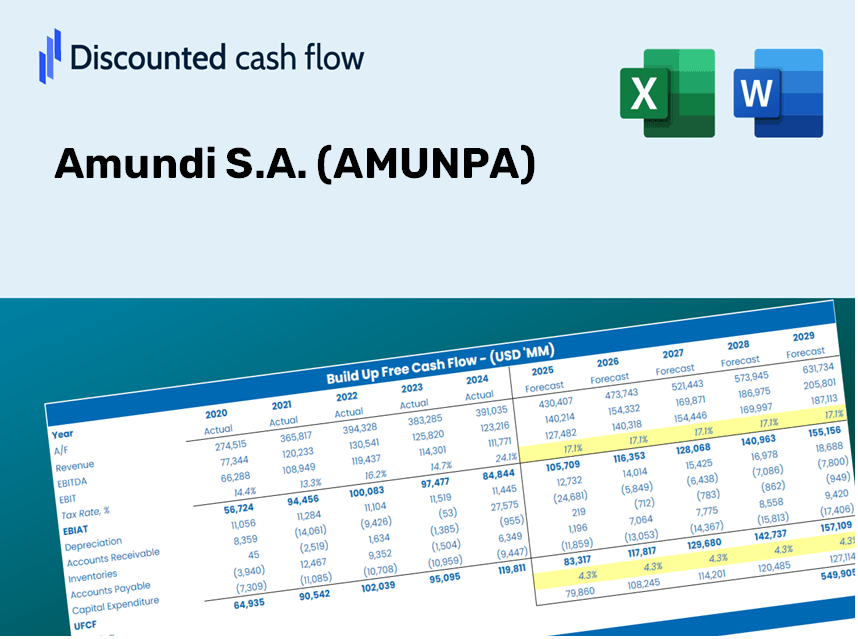
- Customizable Excel Template: An adaptable Excel-based DCF Calculator featuring pre-entered financials for Amundi S.A. (AMUNPA).
- Actual Data: Historical performance metrics and forward-looking estimates (highlighted in the yellow cells).
- Flexible Forecasting: Adjust variables such as revenue growth, EBITDA percentage, and WACC to suit your analysis.
- Instant Calculations: Quickly observe how your adjustments affect the valuation of Amundi S.A. (AMUNPA).
- Professional-Grade Tool: Designed for investors, CFOs, consultants, and financial analysts.
- User-Centric Layout: Organized for straightforward navigation and includes step-by-step guidance.
Key Features
- Pre-Loaded Data: Amundi S.A.'s historical financial statements and pre-filled forecasts.
- Fully Adjustable Inputs: Modify WACC, tax rates, revenue growth, and EBITDA margins.
- Instant Results: Watch Amundi S.A.'s intrinsic value update in real time.
- Clear Visual Outputs: Dashboard charts illustrate valuation results and key metrics.
- Built for Accuracy: A professional tool designed for analysts, investors, and finance professionals.
How It Functions
- 1. Access the Template: Download and open the Excel file featuring Amundi S.A.'s preloaded data.
- 2. Modify Assumptions: Adjust key inputs such as growth rates, WACC, and capital expenditures.
- 3. View Results Instantly: The DCF model automatically calculates intrinsic value and NPV.
- 4. Experiment with Scenarios: Evaluate multiple forecasts to explore various valuation outcomes.
- 5. Present with Assurance: Deliver professional valuation insights to bolster your decision-making.
Why Use This Calculator for Amundi S.A. (AMUNPA)?
- Reliable Data: Up-to-date Amundi financials provide trustworthy valuation outcomes.
- Flexible Options: Modify essential parameters like growth rates, WACC, and tax rates to align with your forecasts.
- Efficiency Boost: Built-in calculations save you from starting from ground zero.
- High-Quality Tool: Tailored for investors, analysts, and financial consultants.
- Easy to Use: User-friendly interface and clear, step-by-step guidance are suitable for all experience levels.
Who Should Benefit from Amundi S.A. (AMUNPA)?
- Individual Investors: Gain insights to make educated choices regarding Amundi S.A. (AMUNPA) shares.
- Financial Analysts: Enhance valuation methodologies with comprehensive financial models tailored for Amundi S.A. (AMUNPA).
- Consultants: Provide clients with precise and insightful valuation analyses of Amundi S.A. (AMUNPA).
- Business Owners: Learn from the valuation strategies of leading firms like Amundi S.A. (AMUNPA) to inform your business decisions.
- Finance Students: Develop mastery of valuation practices using actual data and case studies focused on Amundi S.A. (AMUNPA).
Features of the Template
- Pre-Filled DCF Model: Amundi S.A.’s financial data preloaded for immediate analysis.
- WACC Calculator: Comprehensive calculations for Weighted Average Cost of Capital.
- Financial Ratios: Assess Amundi S.A.'s profitability, leverage, and operational efficiency.
- Editable Inputs: Modify assumptions like growth rates, margins, and CAPEX to suit your projections.
- Financial Statements: Access to annual and quarterly reports for thorough examination.
- Interactive Dashboard: Effortlessly visualize essential valuation metrics and outcomes.
Disclaimer
All information, articles, and product details provided on this website are for general informational and educational purposes only. We do not claim any ownership over, nor do we intend to infringe upon, any trademarks, copyrights, logos, brand names, or other intellectual property mentioned or depicted on this site. Such intellectual property remains the property of its respective owners, and any references here are made solely for identification or informational purposes, without implying any affiliation, endorsement, or partnership.
We make no representations or warranties, express or implied, regarding the accuracy, completeness, or suitability of any content or products presented. Nothing on this website should be construed as legal, tax, investment, financial, medical, or other professional advice. In addition, no part of this site—including articles or product references—constitutes a solicitation, recommendation, endorsement, advertisement, or offer to buy or sell any securities, franchises, or other financial instruments, particularly in jurisdictions where such activity would be unlawful.
All content is of a general nature and may not address the specific circumstances of any individual or entity. It is not a substitute for professional advice or services. Any actions you take based on the information provided here are strictly at your own risk. You accept full responsibility for any decisions or outcomes arising from your use of this website and agree to release us from any liability in connection with your use of, or reliance upon, the content or products found herein.