
|
The Andersons, Inc. (ANDE): BCG Matrix [Apr-2026 Updated] |
Fully Editable: Tailor To Your Needs In Excel Or Sheets
Professional Design: Trusted, Industry-Standard Templates
Investor-Approved Valuation Models
MAC/PC Compatible, Fully Unlocked
No Expertise Is Needed; Easy To Follow
The Andersons, Inc. (ANDE) Bundle
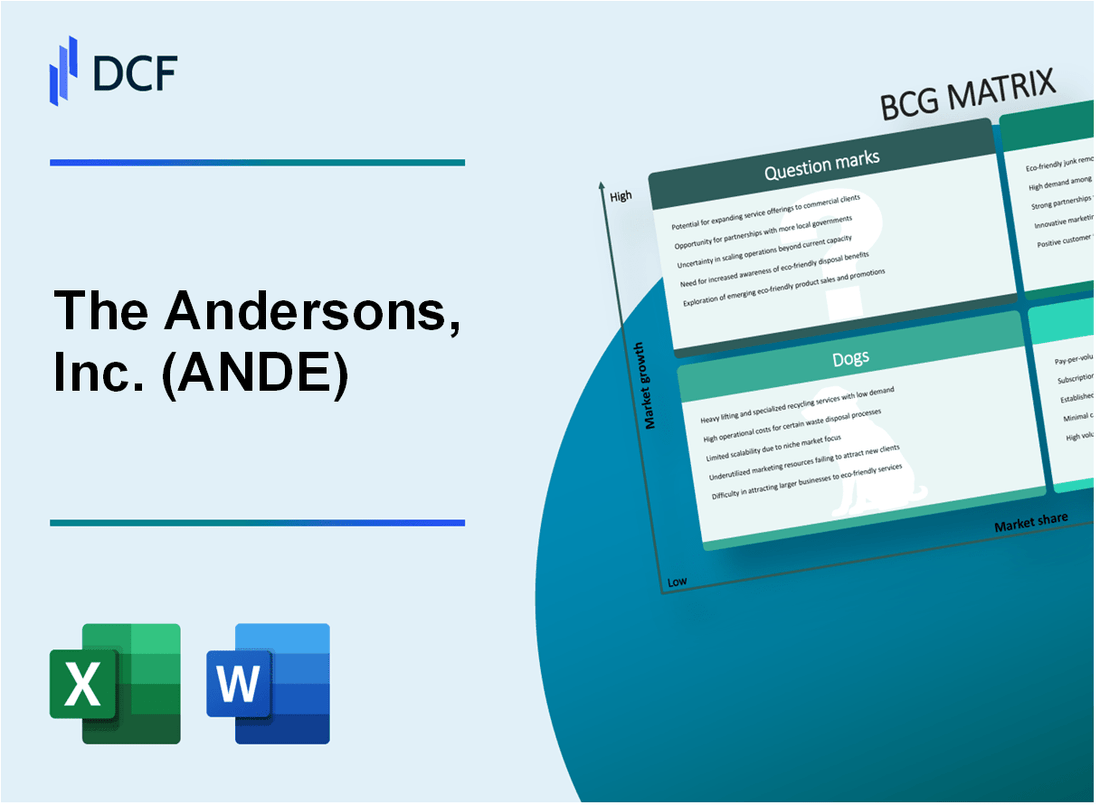
You're looking for a clear-eyed view of The Andersons, Inc.'s portfolio, and the BCG Matrix is defintely the right tool to simplify their complex mix of commodity trading, ethanol, and nutrients. Here's the quick math on where their businesses stand as of late 2025, mapping their market growth against their relative market share. The picture shows Stars in Renewables, benefiting from a July 2025 full ownership buy and anticipated $20 million in clean fuel tax credits, while the core Agribusiness (Trade) remains a solid Cash Cow with $11.60 billion in trailing revenue. On the flip side, legacy nutrient lines are showing up as Dogs, with Q3 adjusted income dropping to just $2 million, even as high-potential export capacity projects loom as exciting Question Marks. Keep reading to see the precise positioning of each unit and what it means for your strategy with The Andersons, Inc.
Background of The Andersons, Inc. (ANDE)
You're looking at The Andersons, Inc. (ANDE) as of late 2025, and honestly, it's a company deeply rooted in agriculture but with a significant pivot toward renewables. The Andersons, Inc. is a diversified agribusiness and renewable energy company operating across the United States, Canada, and Mexico, among other international markets.
Financially speaking, the scale is substantial. For the quarter ending September 30, 2025, The Andersons, Inc. reported sales and merchandising revenues of $2,677.7 million, which was a modest increase of 2.2% year-over-year. The trailing twelve-month revenue, as of that same date, stood at $11.60B, marking a 2.19% increase over the prior twelve months.
The company organizes its operations into key segments, though the naming conventions shift a bit between reports. The most recent analyst profiles generally point to three main areas: Trade, Renewables, and Nutrient & Industrial. The Trade segment, which handles the movement of physical commodities like grain and fuel products, is typically the one generating the bulk of the revenue.
The Renewables segment has been a major focus for strategic deployment of capital this year. For instance, The Andersons, Inc. closed on acquiring the remaining ownership interest in The Andersons Marathon Holdings LLC (TAMH) on July 31, 2025, for a net purchase price of $385 million. This move effectively doubled their financial ownership in the ethanol industry, a key growth pillar for them. In the first nine months of 2025, the Renewables segment produced 620.7 million gallons of ethanol.
Looking at the bottom line for the third quarter of 2025, net income attributable to The Andersons, Inc. was $20.1 million, a step down from the $27.4 million reported in the same period last year. This resulted in a diluted earnings per share of $0.59, compared to $0.80 the year prior. Segment-wise, Q1 2025 showed the Renewables segment performing strongly with $25 million in pretax income, while Agribusiness faced stagnant markets and recorded a pretax loss of $10 million. Still, the Q3 revenue growth was partly driven by the Skyland acquisition within the Agribusiness side, which added $478.6 million in sales for that quarter alone.
As of late October/November 2025, the stock was trading around $47.36 to $49.63, with a market capitalization hovering near $1.65 billion. Analysts, on average, were leaning toward a 'Moderate Buy' rating, setting a consensus price target around $53.33. The company's debt-to-adjusted EBITDA ratio was reported at 1.8 times, which is well under their stated target of 2.5 times, suggesting a solid balance sheet position heading into the end of the year.
The Andersons, Inc. (ANDE) - BCG Matrix: Stars
The Renewables segment is positioned as a Star, reflecting high growth potential driven by strategic moves and regulatory tailwinds. This focus follows The Andersons, Inc.'s acquisition of the remaining 49.9% ownership interest in The Andersons Marathon Holdings LLC (TAMH) for $425 million, inclusive of $40 million of working capital, which closed on July 31, 2025. This transaction effectively doubled the company's financial ownership in the ethanol industry, a key pillar of the Renewables strategy.
This segment benefits significantly from government support, specifically the 45Z clean fuel production tax credits. The Andersons, Inc. noted it had recorded $20 million in 45Z clean fuel production tax credits year-to-date as of the third quarter of 2025. Management further anticipates an EBITDA benefit from these credits of $10 million to $15 million on a net basis for the 2025 Q4 period. The continuation of the 45Z tax credits through 2029 supports future growth expectations for this area.
Operational growth in the segment is evident in the production figures, showing strong execution following the full ownership consolidation. The company's ethanol plants continued to run efficiently, a key factor in maximizing the benefit from the new tax credits.
Here are the key operational metrics for the Renewables segment as of the latest reporting:
| Metric | Value | Period/Context |
| Ethanol Production Volume | 620.7 million gallons | First nine months of 2025 |
| Prior Year Ethanol Production Volume | 585.2 million gallons | First nine months of 2024 |
| Renewables Segment Pretax Income | $43 million | Third Quarter 2025 |
| Renewables Segment Adjusted EBITDA | $67 million | Third Quarter 2025 |
| 45Z Tax Credits Recognized Year-to-Date | $20 million | As of Q3 2025 |
| TAMH Annual Production Capacity | 500 million gallons | Total capacity of the four acquired plants |
To sustain and enhance this leadership position, The Andersons, Inc. has earmarked strategic capital investments. The company expects to invest approximately $200 million in property, plant and equipment for the full year 2025, excluding acquisitions. This level of capital spending compares to $149.2 million in capital expenditures for 2024, with $49.8 million specifically allocated to Renewables in that prior year.
These investments are directly aimed at improving the segment's competitive standing by:
- Improving plant production efficiency for ethanol and co-products.
- Lowering the carbon intensity (CI) score of the ethanol produced.
- Growing renewable feedstocks merchandising.
The full ownership of the ethanol plants, which The Andersons, Inc. was already operating, limits execution risk as they implement these efficiency and CI-lowering projects.
The Andersons, Inc. (ANDE) - BCG Matrix: Cash Cows
The Agribusiness segment at The Andersons, Inc. functions as a primary Cash Cow, characterized by a high market presence in a mature, albeit volatile, industry. This segment is the core revenue driver, with trailing twelve-month revenue of $11.60 billion as of Q3 2025, based on the strategic positioning framework. For context, the segment reported revenues of $1,989 million for the third quarter ended September 30, 2025.
This unit generates substantial operating cash flow, reporting $299,321 thousand in cash from operating activities in Q2 2025. This consistent cash generation is vital for funding other areas of The Andersons, Inc. portfolio. The segment's profitability in Q3 2025 reflected market pressures, with pretax income at $1 million and adjusted pretax income at $2 million. Still, the adjusted EBITDA for Agribusiness in Q3 2025 was $29 million.
The high relative market share in North American grain handling is bolstered by strategic moves, such as the finalization of the majority ownership in Skyland Grain, LLC, which occurred in November 2024 for $85 million for a 65% stake. This acquisition is part of the ongoing effort to integrate assets and improve efficiency. The Andersons, Inc. strives to maintain this market leadership through disciplined investment, even as commodity market volatility presents inherent risks. The Skyland integration is a key focus, with its FY25 EBITDA outlook trimmed to $25-$30 million due to western grain weakness.
The stability provided by this segment is crucial for capital allocation across The Andersons, Inc. Here's a look at the recent financial performance metrics for the Agribusiness segment:
| Metric | Value (Q3 2025) | Comparison (Q3 2024) |
| Revenue | $1,989 million | Up from $1,876 million |
| Adjusted Pretax Income | $2 million | Down from $19 million |
| Adjusted EBITDA | $29 million | Down from $45 million |
Cash Cows are the engine of the enterprise, providing the necessary resources for investment elsewhere. The Andersons, Inc. uses this cash flow to support its overall corporate structure and fund growth initiatives in other segments.
- Generates significant cash flow, evidenced by $299,321 thousand in Q2 2025 operating cash flow.
- Maintains a leading position in grain handling following the Skyland Grain acquisition.
- Investments focus on infrastructure to improve efficiency, like the Port of Houston expansion.
- Provides capital for growth despite lower margins in merchandising and grain assets.
- The segment's adjusted EBITDA was $29 million in Q3 2025.
The Andersons, Inc. (ANDE) - BCG Matrix: Dogs
Legacy base nutrient and industrial products within the Agribusiness segment face soft industry fundamentals, which is characteristic of a business unit positioned in the Dogs quadrant of the BCG Matrix. These units operate in low-growth markets and possess a low relative market share, meaning expensive turn-around plans are often ill-advised.
The financial performance of this segment clearly illustrates the cash-trap nature of a Dog, as it neither earns nor consumes significant cash relative to the company's overall results, yet ties up capital.
The segment's Q3 2025 adjusted pretax income was only $2 million, a sharp decline from $19 million in Q3 2024. This substantial drop highlights the pressure from soft industry fundamentals, including trade policy uncertainty and low commodity prices affecting grain assets and merchandising businesses.
The following table details the segment's recent performance metrics:
| Metric | Q3 2025 Value | Q3 2024 Value |
| Adjusted Pretax Income Attributable to Company | $2 million | $19 million |
| Adjusted EBITDA | $29 million | $45 million |
| Segment Revenue | $1,989 million | $1,876 million |
Further pressure comes from related areas. Lower co-product values in Renewables, like corn-based feed ingredients, face pressure from an oversupply of alternatives. Specifically, declines in values of dried distillers grain were noted, which partially offset higher distillers corn oil prices during the quarter.
These mature, low-growth product lines require careful cost management to avoid becoming a drag on overall earnings. The required focus shifts to minimizing cash consumption and maximizing the return on any capital tied up in these operations.
Key factors contributing to the low-growth, low-share environment for these types of products include:
- Trade policy uncertainty impacting merchandising.
- Lower gross profit in grain assets.
- Reduced margins across the asset and merchandising footprint.
- Declines in values of dried distillers grain.
- Lower put-through volumes at assets.
The company is actively managing this through strategic integration and capital allocation, such as integrating Skyland Grain, LLC assets into the Agribusiness segment, even as overall segment profitability declined.
The Andersons, Inc. (ANDE) - BCG Matrix: Question Marks
You're looking at business units that are burning cash now but have the potential to become major profit drivers later. These are the high-growth, low-market-share bets The Andersons, Inc. is making as of 2025.
The new soybean meal export capacity at the Houston port project is a prime example. This venture, expected to be complete by mid-2026, is a high-potential play to increase export capacity for U.S. soybean meal, driven by rising demand for renewable fuels. To get this off the ground, soybean farmer leaders provided a ceremonial check of $275,000 to cover research, design, and pre-engineering costs. Once operational, the expansion will add dedicated storage for up to 22,000 metric tons of soybean meal, building on the facility's existing capacity of 6.3 million bushels of grain and annual exports exceeding two million metric tons.
Renewable diesel feedstock merchandising is another area showing high growth potential, though its market share is still being established. While volumes continue to grow, margins faced compression in the first quarter of 2025 due to refinery build-out delays. Still, management is focused on growing volume in low Carbon Intensity (CI) feedstocks, seeing this as a key growth vector for the Renewables segment.
The investments in carbon intensity reduction projects are high-cost, high-reward bets on future low-carbon fuel markets. The Andersons, Inc. is actively pursuing longer-term capital projects to lower the CI of its ethanol plants, anticipating positive financial results under the Inflation Reduction Act. The company is committed to participating in regulated and voluntary carbon credit markets, dedicating resources to monetize environmental sustainability efforts. This investment strategy is reflected in the capital deployment, with cash spent on capital projects totaling $47 million in the first quarter of 2025, a $20 million increase over the first quarter of 2024.
The integration of the former Trade and Nutrient businesses into the new Agribusiness segment presents execution risk and uncertain near-term returns following the January 1, 2025, realignment. This new structure immediately faced headwinds; the Agribusiness segment recorded a pretax loss of $10 million and breakeven adjusted pretax income attributable to the company for the first quarter of 2025. This performance contrasts sharply with the company's overall strategy to reach an adjusted EBITDA of $475 million by the end of 2026, showing this integration is still finding its footing.
Here's a quick look at the cash consumption and growth focus for these Question Marks:
| Initiative/Area | Metric | Value/Status (as of 2025) |
|---|---|---|
| Houston Port Expansion | Expected Completion | mid-2026 |
| Houston Port Expansion | New Soybean Meal Storage Capacity | 22,000 metric tons |
| Q1 2025 Capital Spending | Total Cash Spent on Projects | $47 million |
| Q1 2025 Capital Spending | Year-over-Year Increase | $20 million increase from Q1 2024 |
| Agribusiness Segment (Post-Integration) | Q1 2025 Pretax Loss | $10 million |
| Overall Company Leverage | Long-term Debt to Adjusted EBITDA Ratio | 1.8 times (Target is 2.5 times) |
The need to quickly gain share or divest is clear, given the cash burn and high investment requirements. You need to watch these closely:
- Investments in low CI ethanol projects.
- Growth in renewable diesel feedstock merchandising volumes.
- Successful integration of the new Agribusiness segment structure.
- Progress on the Houston port facility construction timeline.
Finance: draft 13-week cash view by Friday.
Disclaimer
All information, articles, and product details provided on this website are for general informational and educational purposes only. We do not claim any ownership over, nor do we intend to infringe upon, any trademarks, copyrights, logos, brand names, or other intellectual property mentioned or depicted on this site. Such intellectual property remains the property of its respective owners, and any references here are made solely for identification or informational purposes, without implying any affiliation, endorsement, or partnership.
We make no representations or warranties, express or implied, regarding the accuracy, completeness, or suitability of any content or products presented. Nothing on this website should be construed as legal, tax, investment, financial, medical, or other professional advice. In addition, no part of this site—including articles or product references—constitutes a solicitation, recommendation, endorsement, advertisement, or offer to buy or sell any securities, franchises, or other financial instruments, particularly in jurisdictions where such activity would be unlawful.
All content is of a general nature and may not address the specific circumstances of any individual or entity. It is not a substitute for professional advice or services. Any actions you take based on the information provided here are strictly at your own risk. You accept full responsibility for any decisions or outcomes arising from your use of this website and agree to release us from any liability in connection with your use of, or reliance upon, the content or products found herein.