
|
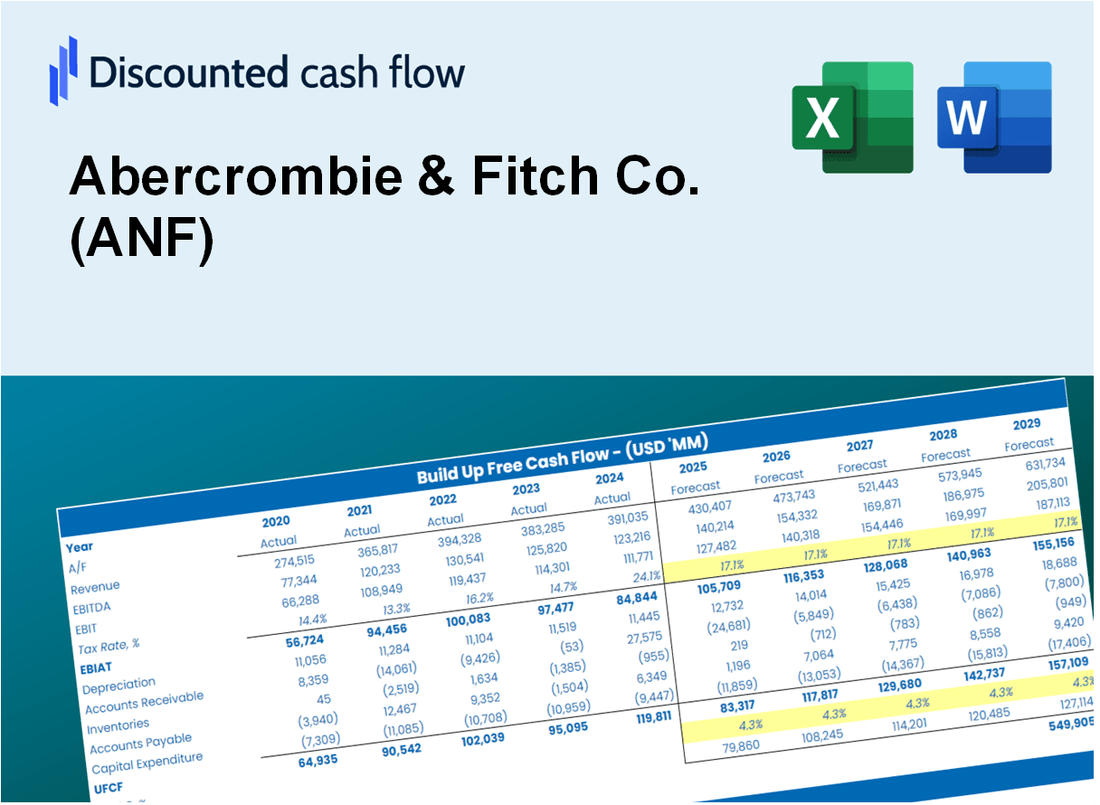
Abercrombie & Fitch Co. (ANF) DCF Valuation |
Fully Editable: Tailor To Your Needs In Excel Or Sheets
Professional Design: Trusted, Industry-Standard Templates
Investor-Approved Valuation Models
MAC/PC Compatible, Fully Unlocked
No Expertise Is Needed; Easy To Follow
Abercrombie & Fitch Co. (ANF) Bundle
Whether you're an investor or analyst, this (ANF) DCF Calculator is your go-to tool for accurate valuation. Loaded with real data from Abercrombie & Fitch Co., you can adjust forecasts and observe the effects in real-time.
What You Will Get
- Real ANF Financial Data: Pre-filled with Abercrombie & Fitch's historical and projected data for precise analysis.
- Fully Editable Template: Modify key inputs like revenue growth, WACC, and EBITDA % with ease.
- Automatic Calculations: See Abercrombie & Fitch's intrinsic value update instantly based on your changes.
- Professional Valuation Tool: Designed for investors, analysts, and consultants seeking accurate DCF results.
- User-Friendly Design: Simple structure and clear instructions for all experience levels.
Key Features
- Comprehensive DCF Calculator: Features detailed unlevered and levered DCF valuation models tailored for Abercrombie & Fitch Co. (ANF).
- WACC Calculator: Pre-configured Weighted Average Cost of Capital sheet with adjustable inputs specific to the retail sector.
- Customizable Forecast Assumptions: Alter growth projections, capital expenditures, and discount rates to suit Abercrombie & Fitch Co. (ANF).
- Integrated Financial Ratios: Evaluate profitability, leverage, and efficiency ratios relevant to Abercrombie & Fitch Co. (ANF).
- Interactive Dashboard and Charts: Visual representations summarize essential valuation metrics for straightforward analysis.
How It Works
- Download: Get the pre-formatted Excel file containing Abercrombie & Fitch Co.'s (ANF) financial information.
- Customize: Modify projections, such as sales growth, EBITDA margin, and discount rate.
- Update Automatically: The intrinsic value and net present value calculations refresh in real-time.
- Test Scenarios: Develop various forecasts and evaluate results instantly.
- Make Decisions: Leverage the valuation outcomes to inform your investment choices.
Why Choose This Calculator for Abercrombie & Fitch Co. (ANF)?
- User-Friendly Interface: Tailored for both novices and seasoned analysts.
- Customizable Inputs: Adjust parameters effortlessly to suit your evaluation needs.
- Real-Time Feedback: Observe immediate updates to Abercrombie & Fitch's valuation as you tweak inputs.
- Preloaded Financials: Comes equipped with Abercrombie & Fitch's actual financial data for swift assessments.
- Relied Upon by Experts: Favored by investors and analysts for making well-informed choices.
Who Should Use This Product?
- Investors: Accurately assess Abercrombie & Fitch Co.’s (ANF) fair value before making investment choices.
- CFOs: Utilize a professional-grade DCF model for financial reporting and analysis specific to Abercrombie & Fitch Co. (ANF).
- Consultants: Swiftly customize the template for valuation reports tailored to Abercrombie & Fitch Co. (ANF) clients.
- Entrepreneurs: Acquire insights into financial modeling practices employed by leading retail companies like Abercrombie & Fitch Co. (ANF).
- Educators: Employ it as a teaching resource to illustrate valuation methodologies relevant to Abercrombie & Fitch Co. (ANF).
What the Template Contains
- Pre-Filled Data: Includes Abercrombie & Fitch Co.'s (ANF) historical financials and forecasts.
- Discounted Cash Flow Model: Editable DCF valuation model with automatic calculations.
- Weighted Average Cost of Capital (WACC): A dedicated sheet for calculating WACC based on custom inputs.
- Key Financial Ratios: Analyze Abercrombie & Fitch Co.'s (ANF) profitability, efficiency, and leverage.
- Customizable Inputs: Edit revenue growth, margins, and tax rates with ease.
- Clear Dashboard: Charts and tables summarizing key valuation results.
Disclaimer
All information, articles, and product details provided on this website are for general informational and educational purposes only. We do not claim any ownership over, nor do we intend to infringe upon, any trademarks, copyrights, logos, brand names, or other intellectual property mentioned or depicted on this site. Such intellectual property remains the property of its respective owners, and any references here are made solely for identification or informational purposes, without implying any affiliation, endorsement, or partnership.
We make no representations or warranties, express or implied, regarding the accuracy, completeness, or suitability of any content or products presented. Nothing on this website should be construed as legal, tax, investment, financial, medical, or other professional advice. In addition, no part of this site—including articles or product references—constitutes a solicitation, recommendation, endorsement, advertisement, or offer to buy or sell any securities, franchises, or other financial instruments, particularly in jurisdictions where such activity would be unlawful.
All content is of a general nature and may not address the specific circumstances of any individual or entity. It is not a substitute for professional advice or services. Any actions you take based on the information provided here are strictly at your own risk. You accept full responsibility for any decisions or outcomes arising from your use of this website and agree to release us from any liability in connection with your use of, or reliance upon, the content or products found herein.