|
Apellis Pharmaceuticals, Inc. (APLS) DCF Valuation |
Fully Editable: Tailor To Your Needs In Excel Or Sheets
Professional Design: Trusted, Industry-Standard Templates
Investor-Approved Valuation Models
MAC/PC Compatible, Fully Unlocked
No Expertise Is Needed; Easy To Follow
Apellis Pharmaceuticals, Inc. (APLS) Bundle
Evaluate the financial prospects of Apellis Pharmaceuticals, Inc. (APLS) like an expert! This (APLS) DCF Calculator provides pre-filled financial data and full flexibility to modify revenue growth, WACC, margins, and other essential assumptions to align with your projections.
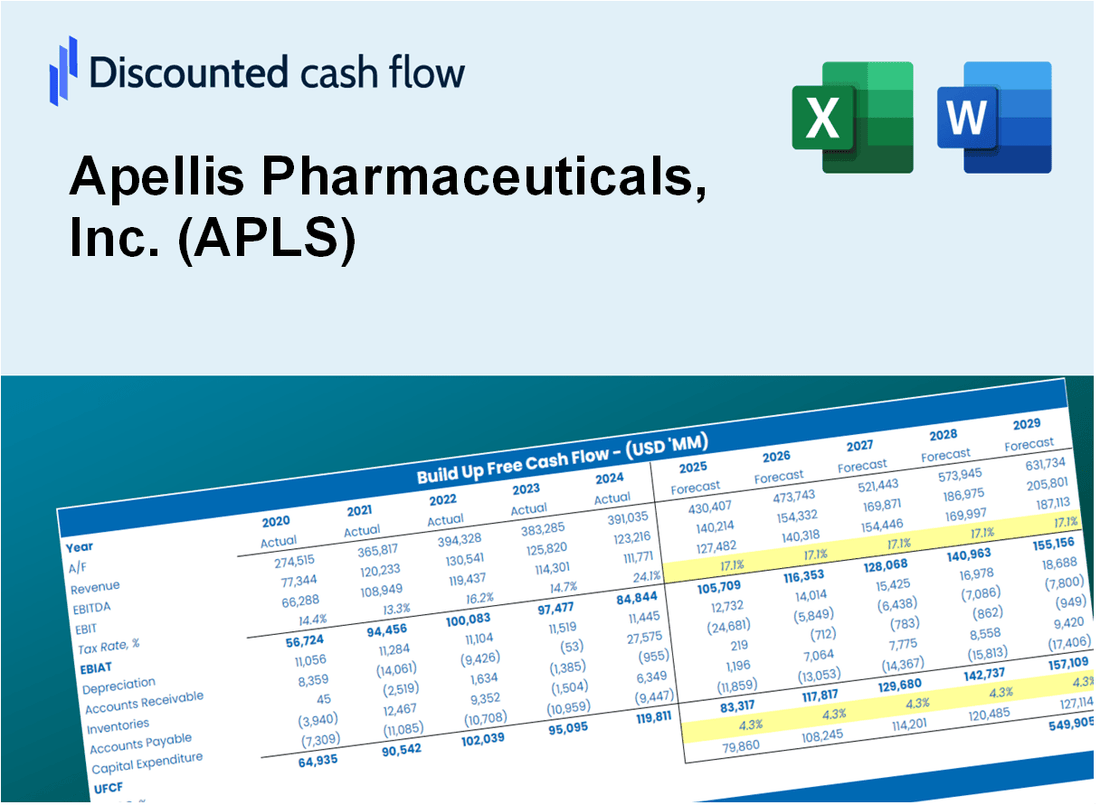
Discounted Cash Flow (DCF) - (USD MM)
| Year | AY1 2020 |
AY2 2021 |
AY3 2022 |
AY4 2023 |
AY5 2024 |
FY1 2025 |
FY2 2026 |
FY3 2027 |
FY4 2028 |
FY5 2029 |
|---|---|---|---|---|---|---|---|---|---|---|
| Revenue | 250.6 | 66.6 | 75.4 | 396.6 | 781.4 | 1,048.8 | 1,407.7 | 1,889.4 | 2,536.0 | 3,403.8 |
| Revenue Growth, % | 0 | -73.44 | 13.31 | 425.83 | 97.02 | 34.22 | 34.22 | 34.22 | 34.22 | 34.22 |
| EBITDA | -312.2 | -731.3 | -617.4 | -495.2 | -154.5 | -880.5 | -1,181.8 | -1,586.2 | -2,129.1 | -2,857.7 |
| EBITDA, % | -124.57 | -1098.61 | -818.58 | -124.87 | -19.78 | -83.96 | -83.96 | -83.96 | -83.96 | -83.96 |
| Depreciation | .9 | 1.5 | 1.5 | 1.7 | 1.8 | 10.9 | 14.7 | 19.7 | 26.5 | 35.5 |
| Depreciation, % | 0.34271 | 2.24 | 1.97 | 0.42966 | 0.22998 | 1.04 | 1.04 | 1.04 | 1.04 | 1.04 |
| EBIT | -313.1 | -732.8 | -618.9 | -496.9 | -156.3 | -881.0 | -1,182.5 | -1,587.1 | -2,130.3 | -2,859.3 |
| EBIT, % | -124.91 | -1100.85 | -820.55 | -125.3 | -20.01 | -84 | -84 | -84 | -84 | -84 |
| Total Cash | 877.6 | 700.6 | 551.8 | 352.3 | 411.3 | 926.0 | 1,242.9 | 1,668.2 | 2,239.1 | 3,005.4 |
| Total Cash, percent | .0 | .0 | .0 | .0 | .0 | .0 | .0 | .0 | .0 | .0 |
| Account Receivables | 25.0 | 10.1 | 7.7 | 206.4 | 271.7 | 256.4 | 344.1 | 461.9 | 619.9 | 832.1 |
| Account Receivables, % | 9.97 | 15.18 | 10.25 | 52.05 | 34.78 | 24.45 | 24.45 | 24.45 | 24.45 | 24.45 |
| Inventories | .0 | 16.3 | 85.7 | 146.4 | 81.4 | 360.3 | 483.6 | 649.2 | 871.3 | 1,169.5 |
| Inventories, % | 0 | 24.47 | 113.65 | 36.91 | 10.42 | 34.36 | 34.36 | 34.36 | 34.36 | 34.36 |
| Accounts Payable | 8.5 | 16.9 | 37.3 | 37.5 | 38.6 | 194.4 | 261.0 | 350.3 | 470.1 | 631.0 |
| Accounts Payable, % | 3.38 | 25.4 | 49.51 | 9.46 | 4.94 | 18.54 | 18.54 | 18.54 | 18.54 | 18.54 |
| Capital Expenditure | -5.4 | -1.1 | -1.5 | -.8 | -.4 | -12.8 | -17.1 | -23.0 | -30.9 | -41.4 |
| Capital Expenditure, % | -2.16 | -1.66 | -2.02 | -0.19491 | -0.05157628 | -1.22 | -1.22 | -1.22 | -1.22 | -1.22 |
| Tax Rate, % | -0.5907 | -0.5907 | -0.5907 | -0.5907 | -0.5907 | -0.5907 | -0.5907 | -0.5907 | -0.5907 | -0.5907 |
| EBITAT | -314.8 | -733.1 | -619.5 | -498.9 | -157.2 | -881.0 | -1,182.5 | -1,587.1 | -2,130.3 | -2,859.3 |
| Depreciation | ||||||||||
| Changes in Account Receivables | ||||||||||
| Changes in Inventories | ||||||||||
| Changes in Accounts Payable | ||||||||||
| Capital Expenditure | ||||||||||
| UFCF | -335.9 | -725.7 | -666.2 | -757.2 | -155.1 | -990.5 | -1,329.4 | -1,784.4 | -2,395.0 | -3,214.6 |
| WACC, % | 7.04 | 7.04 | 7.04 | 7.04 | 7.04 | 7.04 | 7.04 | 7.04 | 7.04 | 7.04 |
| PV UFCF | ||||||||||
| SUM PV UFCF | -7,653.7 | |||||||||
| Long Term Growth Rate, % | 2.00 | |||||||||
| Free cash flow (T + 1) | -3,279 | |||||||||
| Terminal Value | -65,106 | |||||||||
| Present Terminal Value | -46,341 | |||||||||
| Enterprise Value | -53,994 | |||||||||
| Net Debt | 58 | |||||||||
| Equity Value | -54,053 | |||||||||
| Diluted Shares Outstanding, MM | 124 | |||||||||
| Equity Value Per Share | -436.24 |
What You Will Get
- Editable Excel Template: A fully customizable Excel-based DCF Calculator featuring pre-filled real APLS financials.
- Real-World Data: Historical data and forward-looking estimates (as indicated in the yellow cells).
- Forecast Flexibility: Adjust forecast assumptions such as revenue growth, EBITDA %, and WACC.
- Automatic Calculations: Instantly observe the effect of your inputs on Apellis Pharmaceuticals’ valuation.
- Professional Tool: Designed for investors, CFOs, consultants, and financial analysts.
- User-Friendly Design: Organized for clarity and ease of use, complete with step-by-step instructions.
Key Features
- Comprehensive Financial Data: Gain access to precise historical performance and future outlooks for Apellis Pharmaceuticals, Inc. (APLS).
- Adjustable Forecast Parameters: Modify highlighted cells for key metrics such as WACC, growth rates, and profit margins.
- Real-Time Calculations: Instantaneous updates to DCF, Net Present Value (NPV), and cash flow assessments.
- User-Friendly Dashboard: Intuitive charts and summaries to effectively illustrate your valuation findings.
- Suitable for All Experience Levels: Designed for investors, CFOs, and consultants alike, with an easy-to-navigate format.
How It Works
- 1. Access the Template: Download and open the Excel file containing Apellis Pharmaceuticals, Inc. (APLS) preloaded data.
- 2. Modify Assumptions: Adjust key inputs such as growth rates, WACC, and capital expenditures to fit your analysis.
- 3. Analyze Results Immediately: The DCF model automatically calculates the intrinsic value and NPV based on your inputs.
- 4. Explore Scenarios: Evaluate various forecasts to examine different valuation scenarios.
- 5. Present with Assurance: Deliver professional valuation insights to enhance your decision-making process.
Why Choose Apellis Pharmaceuticals, Inc. (APLS)?
- Innovative Solutions: Cutting-edge therapies designed to address unmet medical needs.
- Proven Expertise: A team of industry leaders committed to advancing healthcare.
- Patient-Centric Approach: Focused on improving patient outcomes through targeted treatments.
- Robust Pipeline: A diverse range of products in development to tackle various conditions.
- Strong Commitment to Research: Ongoing investment in research and development to drive innovation.
Who Should Use This Product?
- Pharmaceutical Students: Understand drug development processes and apply them using real case studies.
- Researchers: Integrate advanced modeling into your studies or clinical research.
- Investors: Evaluate your investment strategies and analyze the performance of Apellis Pharmaceuticals (APLS).
- Market Analysts: Enhance your analysis with a customizable financial model tailored for biopharmaceuticals.
- Healthcare Professionals: Learn how companies like Apellis are evaluated in the context of market trends.
What the Template Contains
- Preloaded APLS Data: Historical and projected financial data, including revenue, EBIT, and capital expenditures.
- DCF and WACC Models: Professional-grade sheets for calculating intrinsic value and Weighted Average Cost of Capital.
- Editable Inputs: Yellow-highlighted cells for adjusting revenue growth, tax rates, and discount rates.
- Financial Statements: Comprehensive annual and quarterly financials for deeper analysis.
- Key Ratios: Profitability, leverage, and efficiency ratios to evaluate performance.
- Dashboard and Charts: Visual summaries of valuation outcomes and assumptions.
Disclaimer
All information, articles, and product details provided on this website are for general informational and educational purposes only. We do not claim any ownership over, nor do we intend to infringe upon, any trademarks, copyrights, logos, brand names, or other intellectual property mentioned or depicted on this site. Such intellectual property remains the property of its respective owners, and any references here are made solely for identification or informational purposes, without implying any affiliation, endorsement, or partnership.
We make no representations or warranties, express or implied, regarding the accuracy, completeness, or suitability of any content or products presented. Nothing on this website should be construed as legal, tax, investment, financial, medical, or other professional advice. In addition, no part of this site—including articles or product references—constitutes a solicitation, recommendation, endorsement, advertisement, or offer to buy or sell any securities, franchises, or other financial instruments, particularly in jurisdictions where such activity would be unlawful.
All content is of a general nature and may not address the specific circumstances of any individual or entity. It is not a substitute for professional advice or services. Any actions you take based on the information provided here are strictly at your own risk. You accept full responsibility for any decisions or outcomes arising from your use of this website and agree to release us from any liability in connection with your use of, or reliance upon, the content or products found herein.