
|
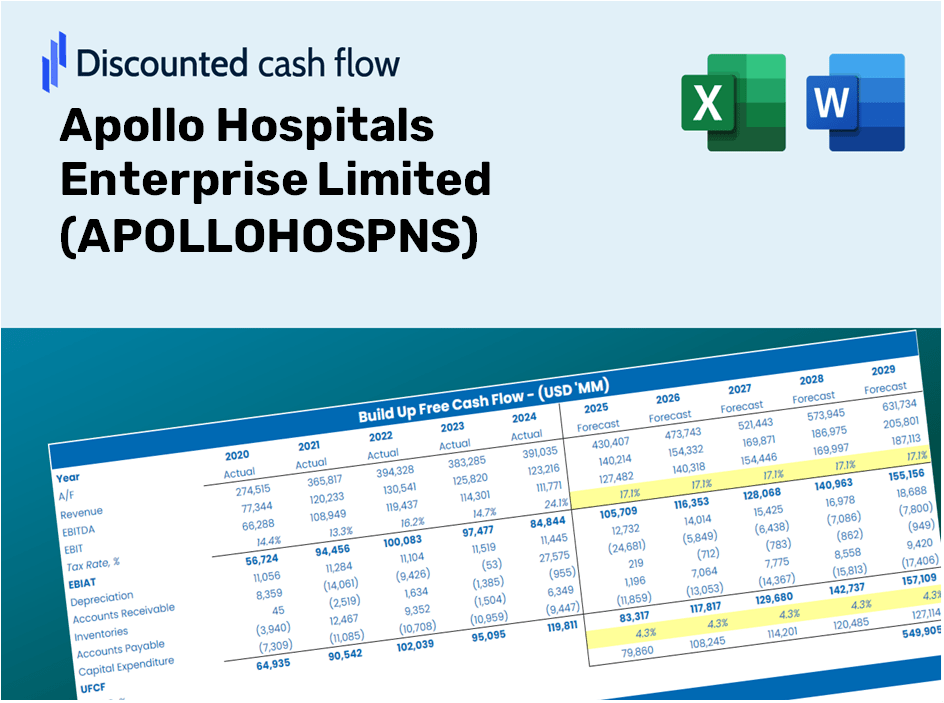
Apollo Hospitals Enterprise Limited (APOLLOHOSP.NS) DCF Valuation |
Fully Editable: Tailor To Your Needs In Excel Or Sheets
Professional Design: Trusted, Industry-Standard Templates
Investor-Approved Valuation Models
MAC/PC Compatible, Fully Unlocked
No Expertise Is Needed; Easy To Follow
Apollo Hospitals Enterprise Limited (APOLLOHOSP.NS) Bundle
Gain mastery over your Apollo Hospitals Enterprise Limited (APOLLOHOSPNS) valuation analysis with our state-of-the-art DCF Calculator! Equipped with real (APOLLOHOSPNS) data, this Excel template enables you to adjust forecasts and assumptions, allowing for precise calculations of Apollo Hospitals' intrinsic value.
Discounted Cash Flow (DCF) - (USD MM)
| Year | AY1 2021 |
AY2 2022 |
AY3 2023 |
AY4 2024 |
AY5 2025 |
FY1 2026 |
FY2 2027 |
FY3 2028 |
FY4 2029 |
FY5 2030 |
|---|---|---|---|---|---|---|---|---|---|---|
| Revenue | 105,600.0 | 146,626.0 | 166,124.5 | 190,592.0 | 217,940.0 | 262,195.9 | 315,438.7 | 379,493.1 | 456,554.8 | 549,265.0 |
| Revenue Growth, % | 0 | 38.85 | 13.3 | 14.73 | 14.35 | 20.31 | 20.31 | 20.31 | 20.31 | 20.31 |
| EBITDA | 12,424.0 | 25,568.0 | 21,393.0 | 24,020.0 | 32,221.0 | 36,428.2 | 43,825.5 | 52,724.9 | 63,431.5 | 76,312.2 |
| EBITDA, % | 11.77 | 17.44 | 12.88 | 12.6 | 14.78 | 13.89 | 13.89 | 13.89 | 13.89 | 13.89 |
| Depreciation | 5,725.0 | 6,001.0 | 6,148.0 | 6,864.0 | 7,575.0 | 10,641.0 | 12,801.8 | 15,401.4 | 18,528.9 | 22,291.5 |
| Depreciation, % | 5.42 | 4.09 | 3.7 | 3.6 | 3.48 | 4.06 | 4.06 | 4.06 | 4.06 | 4.06 |
| EBIT | 6,699.0 | 19,567.0 | 15,245.0 | 17,156.0 | 24,646.0 | 25,787.2 | 31,023.7 | 37,323.5 | 44,902.6 | 54,020.7 |
| EBIT, % | 6.34 | 13.34 | 9.18 | 9 | 11.31 | 9.84 | 9.84 | 9.84 | 9.84 | 9.84 |
| Total Cash | 14,230.0 | 10,478.0 | 7,256.0 | 11,895.0 | 27,925.0 | 23,096.1 | 27,786.0 | 33,428.4 | 40,216.5 | 48,383.1 |
| Total Cash, percent | .0 | .0 | .0 | .0 | .0 | .0 | .0 | .0 | .0 | .0 |
| Account Receivables | 14,924.0 | 19,497.0 | 25,043.0 | 26,608.0 | 31,934.0 | 37,293.6 | 44,866.7 | 53,977.5 | 64,938.4 | 78,125.1 |
| Account Receivables, % | 14.13 | 13.3 | 15.07 | 13.96 | 14.65 | 14.22 | 14.22 | 14.22 | 14.22 | 14.22 |
| Inventories | 2,495.0 | 4,319.0 | 3,901.9 | 4,598.0 | 4,808.0 | 6,437.3 | 7,744.4 | 9,317.1 | 11,209.0 | 13,485.2 |
| Inventories, % | 2.36 | 2.95 | 2.35 | 2.41 | 2.21 | 2.46 | 2.46 | 2.46 | 2.46 | 2.46 |
| Accounts Payable | 11,600.0 | 16,318.0 | 19,156.0 | 23,686.0 | 22,405.0 | 29,551.0 | 35,551.8 | 42,771.1 | 51,456.4 | 61,905.3 |
| Accounts Payable, % | 10.98 | 11.13 | 11.53 | 12.43 | 10.28 | 11.27 | 11.27 | 11.27 | 11.27 | 11.27 |
| Capital Expenditure | -2,955.0 | -6,572.0 | -11,285.2 | -11,368.0 | -17,127.0 | -14,628.9 | -17,599.5 | -21,173.3 | -25,472.9 | -30,645.5 |
| Capital Expenditure, % | -2.8 | -4.48 | -6.79 | -5.96 | -7.86 | -5.58 | -5.58 | -5.58 | -5.58 | -5.58 |
| Tax Rate, % | 29.09 | 29.09 | 29.09 | 29.09 | 29.09 | 29.09 | 29.09 | 29.09 | 29.09 | 29.09 |
| EBITAT | 4,565.2 | 13,088.5 | 11,344.0 | 11,167.2 | 17,476.2 | 17,816.4 | 21,434.3 | 25,786.8 | 31,023.2 | 37,322.9 |
| Depreciation | ||||||||||
| Changes in Account Receivables | ||||||||||
| Changes in Inventories | ||||||||||
| Changes in Accounts Payable | ||||||||||
| Capital Expenditure | ||||||||||
| UFCF | 1,516.2 | 10,838.5 | 3,915.9 | 8,932.1 | 1,107.2 | 13,985.7 | 13,757.2 | 16,550.8 | 19,911.7 | 23,955.0 |
| WACC, % | 4.62 | 4.61 | 4.64 | 4.61 | 4.63 | 4.62 | 4.62 | 4.62 | 4.62 | 4.62 |
| PV UFCF | ||||||||||
| SUM PV UFCF | 76,120.2 | |||||||||
| Long Term Growth Rate, % | 4.00 | |||||||||
| Free cash flow (T + 1) | 24,913 | |||||||||
| Terminal Value | 4,007,715 | |||||||||
| Present Terminal Value | 3,197,344 | |||||||||
| Enterprise Value | 3,273,464 | |||||||||
| Net Debt | 65,041 | |||||||||
| Equity Value | 3,208,423 | |||||||||
| Diluted Shares Outstanding, MM | 144 | |||||||||
| Equity Value Per Share | 22,311.55 |
What You Will Receive
- Customizable Excel Template: A fully adjustable Excel-based DCF Calculator featuring pre-filled real APOLLOHOSPNS financial data.
- Comprehensive Data: Access to historical figures and forward-looking projections (highlighted in the yellow cells).
- Adjustable Forecasts: Modify key assumptions such as revenue growth, EBITDA %, and WACC to suit your analysis.
- Instant Calculations: Quickly observe how your inputs affect the valuation of Apollo Hospitals.
- Designed for Professionals: Ideal for investors, CFOs, consultants, and financial analysts.
- Intuitive Interface: Organized for ease of understanding and usability, complete with step-by-step guidance.
Key Features
- Comprehensive Historical Data: Access Apollo Hospitals’ financial records and pre-populated forecasts.
- Customizable Variables: Modify WACC, tax rates, revenue growth, and EBITDA margins to suit your analysis.
- Real-Time Results: Watch the intrinsic value of Apollo Hospitals recalibrate instantly.
- Insightful Visual Representations: Interactive dashboard charts illustrate valuation outcomes and essential metrics.
- Designed for Precision: An essential tool for analysts, investors, and finance professionals.
How It Operates
- Step 1: Download the prebuilt Excel template featuring Apollo Hospitals Enterprise Limited’s data.
- Step 2: Navigate through the filled sheets to grasp the essential metrics.
- Step 3: Modify forecasts and assumptions in the editable yellow cells (WACC, growth, margins).
- Step 4: Instantly access recalculated results, including Apollo's intrinsic value.
- Step 5: Make informed investment decisions or create reports based on the outputs.
Why Choose Apollo Hospitals Enterprise Limited (APOLLOHOSPNS)?
- Save Time: Immediately access comprehensive healthcare insights without the need for extensive setup.
- Enhance Accuracy: Dependable medical data and advanced methodologies minimize discrepancies in health assessments.
- Completely Customizable: Adjust the framework to align with your healthcare strategies and forecasts.
- User-Friendly: Intuitive visuals and outputs facilitate straightforward analysis of healthcare dynamics.
- Endorsed by Professionals: Crafted for healthcare experts who prioritize precision and effectiveness.
Who Should Utilize This Product?
- Investors: Precisely assess the fair value of Apollo Hospitals Enterprise Limited (APOLLOHOSPNS) prior to making investment choices.
- CFOs: Utilize a top-tier DCF model for enhanced financial reporting and analysis.
- Consultants: Seamlessly customize the template for client valuation reports.
- Entrepreneurs: Discover insights into the financial modeling techniques employed by industry leaders.
- Educators: Employ this tool as a resource to illustrate various valuation methodologies.
What the Template Contains
- Preloaded APOLLOHOSPNS Data: Historical and projected financial data, including revenue, EBIT, and capital expenditures.
- DCF and WACC Models: Professional-grade sheets for calculating intrinsic value and Weighted Average Cost of Capital.
- Editable Inputs: Yellow-highlighted cells for adjusting revenue growth, tax rates, and discount rates.
- Financial Statements: Comprehensive annual and quarterly financials for deeper analysis.
- Key Ratios: Profitability, leverage, and efficiency ratios to evaluate performance.
- Dashboard and Charts: Visual summaries of valuation outcomes and assumptions.
Disclaimer
All information, articles, and product details provided on this website are for general informational and educational purposes only. We do not claim any ownership over, nor do we intend to infringe upon, any trademarks, copyrights, logos, brand names, or other intellectual property mentioned or depicted on this site. Such intellectual property remains the property of its respective owners, and any references here are made solely for identification or informational purposes, without implying any affiliation, endorsement, or partnership.
We make no representations or warranties, express or implied, regarding the accuracy, completeness, or suitability of any content or products presented. Nothing on this website should be construed as legal, tax, investment, financial, medical, or other professional advice. In addition, no part of this site—including articles or product references—constitutes a solicitation, recommendation, endorsement, advertisement, or offer to buy or sell any securities, franchises, or other financial instruments, particularly in jurisdictions where such activity would be unlawful.
All content is of a general nature and may not address the specific circumstances of any individual or entity. It is not a substitute for professional advice or services. Any actions you take based on the information provided here are strictly at your own risk. You accept full responsibility for any decisions or outcomes arising from your use of this website and agree to release us from any liability in connection with your use of, or reliance upon, the content or products found herein.