
|
Ardelyx, Inc. (ARDX) DCF Valuation |
Fully Editable: Tailor To Your Needs In Excel Or Sheets
Professional Design: Trusted, Industry-Standard Templates
Investor-Approved Valuation Models
MAC/PC Compatible, Fully Unlocked
No Expertise Is Needed; Easy To Follow
Ardelyx, Inc. (ARDX) Bundle
If you're an investor or analyst, this (ARDX) DCF Calculator is the perfect tool for accurate valuation. Featuring real data from Ardelyx, Inc., you can easily adjust forecasts and observe the effects in real time.
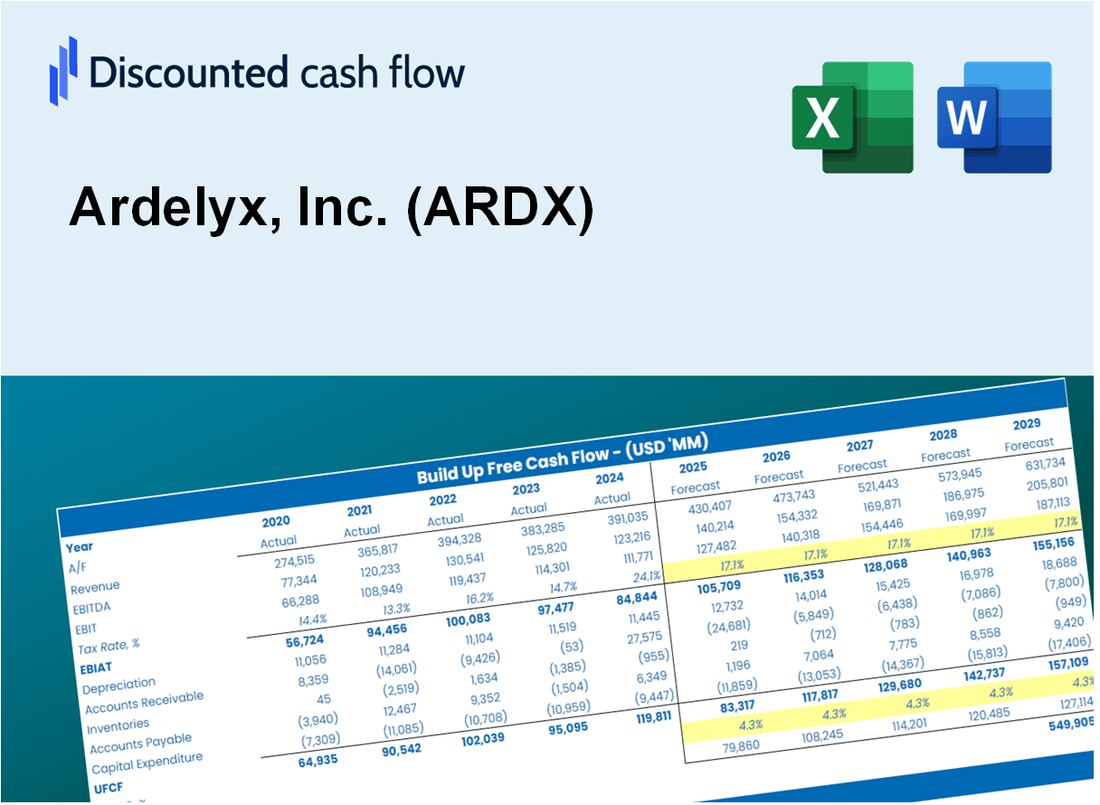
Discounted Cash Flow (DCF) - (USD MM)
| Year | AY1 2020 |
AY2 2021 |
AY3 2022 |
AY4 2023 |
AY5 2024 |
FY1 2025 |
FY2 2026 |
FY3 2027 |
FY4 2028 |
FY5 2029 |
|---|---|---|---|---|---|---|---|---|---|---|
| Revenue | 7.6 | 10.1 | 52.2 | 124.5 | 333.6 | 611.7 | 1,121.4 | 2,056.0 | 3,769.5 | 6,911.0 |
| Revenue Growth, % | 0 | 33.36 | 416.57 | 138.61 | 168.06 | 83.34 | 83.34 | 83.34 | 83.34 | 83.34 |
| EBITDA | -85.2 | -150.9 | -61.0 | -55.4 | -16.7 | -427.5 | -783.8 | -1,437.1 | -2,634.8 | -4,830.6 |
| EBITDA, % | -1125.89 | -1494.03 | -116.92 | -44.48 | -5.01 | -69.9 | -69.9 | -69.9 | -69.9 | -69.9 |
| Depreciation | 4.0 | 4.5 | 4.6 | 1.3 | 2.1 | 131.8 | 241.7 | 443.1 | 812.4 | 1,489.4 |
| Depreciation, % | 52.45 | 44.83 | 8.82 | 1.04 | 0.61838 | 21.55 | 21.55 | 21.55 | 21.55 | 21.55 |
| EBIT | -89.2 | -155.4 | -65.6 | -56.6 | -18.8 | -429.6 | -787.6 | -1,443.9 | -2,647.3 | -4,853.5 |
| EBIT, % | -1178.34 | -1538.85 | -125.74 | -45.51 | -5.63 | -70.23 | -70.23 | -70.23 | -70.23 | -70.23 |
| Total Cash | 186.5 | 116.7 | 123.9 | 184.3 | 250.1 | 581.0 | 1,065.3 | 1,953.1 | 3,580.8 | 6,565.0 |
| Total Cash, percent | .0 | .0 | .0 | .0 | .0 | .0 | .0 | .0 | .0 | .0 |
| Account Receivables | .0 | .5 | 7.7 | 22.0 | 57.7 | 67.0 | 122.9 | 225.3 | 413.1 | 757.4 |
| Account Receivables, % | 0 | 4.97 | 14.83 | 17.7 | 17.3 | 10.96 | 10.96 | 10.96 | 10.96 | 10.96 |
| Inventories | .0 | .0 | 3.3 | 12.4 | 21.2 | 27.7 | 50.8 | 93.1 | 170.7 | 312.9 |
| Inventories, % | 0 | 0 | 6.29 | 10 | 6.35 | 4.53 | 4.53 | 4.53 | 4.53 | 4.53 |
| Accounts Payable | 5.6 | 4.3 | 10.9 | 11.1 | 16.0 | 185.0 | 339.2 | 621.9 | 1,140.2 | 2,090.4 |
| Accounts Payable, % | 74.31 | 42.36 | 20.82 | 8.95 | 4.8 | 30.25 | 30.25 | 30.25 | 30.25 | 30.25 |
| Capital Expenditure | -.3 | -1.9 | -.1 | -.3 | -1.0 | -28.7 | -52.6 | -96.4 | -176.8 | -324.2 |
| Capital Expenditure, % | -4.28 | -18.49 | -0.10545 | -0.2764 | -0.30304 | -4.69 | -4.69 | -4.69 | -4.69 | -4.69 |
| Tax Rate, % | -0.68433 | -0.68433 | -0.68433 | -0.68433 | -0.68433 | -0.68433 | -0.68433 | -0.68433 | -0.68433 | -0.68433 |
| EBITAT | -89.2 | -155.4 | -65.6 | -57.1 | -18.9 | -429.6 | -787.6 | -1,443.9 | -2,647.3 | -4,853.5 |
| Depreciation | ||||||||||
| Changes in Account Receivables | ||||||||||
| Changes in Inventories | ||||||||||
| Changes in Accounts Payable | ||||||||||
| Capital Expenditure | ||||||||||
| UFCF | -79.9 | -154.6 | -65.0 | -79.4 | -57.4 | -173.3 | -523.2 | -959.3 | -1,758.8 | -3,224.7 |
| WACC, % | 6.97 | 6.97 | 6.97 | 6.97 | 6.97 | 6.97 | 6.97 | 6.97 | 6.97 | 6.97 |
| PV UFCF | ||||||||||
| SUM PV UFCF | -5,047.8 | |||||||||
| Long Term Growth Rate, % | 2.00 | |||||||||
| Free cash flow (T + 1) | -3,289 | |||||||||
| Terminal Value | -66,116 | |||||||||
| Present Terminal Value | -47,195 | |||||||||
| Enterprise Value | -52,243 | |||||||||
| Net Debt | 89 | |||||||||
| Equity Value | -52,332 | |||||||||
| Diluted Shares Outstanding, MM | 235 | |||||||||
| Equity Value Per Share | -222.47 |
What You Will Receive
- Comprehensive Financial Model: Ardelyx, Inc.'s actual data facilitates accurate DCF valuation.
- Complete Forecasting Control: Modify revenue growth, profit margins, WACC, and other essential factors.
- Real-Time Calculations: Automatic updates provide immediate feedback as adjustments are made.
- Professional-Grade Template: A polished Excel file crafted for high-quality valuation presentations.
- Flexible and Reusable: Designed for adaptability, allowing for repeated use in detailed financial forecasts.
Key Features
- Comprehensive DCF Calculator: Offers detailed unlevered and levered DCF valuation models tailored for Ardelyx, Inc. (ARDX).
- WACC Calculator: Features a pre-built Weighted Average Cost of Capital sheet with adjustable inputs specific to Ardelyx, Inc. (ARDX).
- Customizable Forecast Assumptions: Easily modify growth rates, capital expenditures, and discount rates for Ardelyx, Inc. (ARDX).
- Integrated Financial Ratios: Evaluate profitability, leverage, and efficiency ratios relevant to Ardelyx, Inc. (ARDX).
- Interactive Dashboard and Charts: Visual representations summarize essential valuation metrics for straightforward analysis of Ardelyx, Inc. (ARDX).
How It Works
- Download: Obtain the pre-formatted Excel file containing Ardelyx, Inc.'s (ARDX) financial data.
- Customize: Modify projections such as revenue growth, EBITDA margin, and WACC.
- Update Automatically: The intrinsic value and NPV calculations refresh in real-time.
- Test Scenarios: Develop various forecasts and compare results immediately.
- Make Decisions: Leverage the valuation findings to inform your investment choices.
Why Choose This Calculator for Ardelyx, Inc. (ARDX)?
- Comprehensive Tool: Integrates DCF, WACC, and financial ratio analyses tailored for Ardelyx, Inc. (ARDX).
- Customizable Inputs: Modify the highlighted cells to explore different financial scenarios for Ardelyx, Inc. (ARDX).
- Detailed Insights: Automatically computes the intrinsic value and Net Present Value for Ardelyx, Inc. (ARDX).
- Preloaded Data: Comes with historical and forecasted data specific to Ardelyx, Inc. (ARDX) for precise analysis.
- Professional Quality: Perfect for financial analysts, investors, and business consultants focusing on Ardelyx, Inc. (ARDX).
Who Should Use This Product?
- Healthcare Professionals: Understand the impact of Ardelyx, Inc. (ARDX) innovations on patient care.
- Researchers: Utilize data from Ardelyx, Inc. (ARDX) to support clinical studies and trials.
- Investors: Evaluate investment opportunities by analyzing the financial metrics of Ardelyx, Inc. (ARDX).
- Pharmaceutical Analysts: Enhance your analysis with detailed reports on Ardelyx, Inc. (ARDX) product pipelines.
- Entrepreneurs: Learn from Ardelyx, Inc. (ARDX) strategies to navigate the biotech industry.
What the Template Contains
- Comprehensive DCF Model: Editable template with detailed valuation calculations specifically for Ardelyx, Inc. (ARDX).
- Real-World Data: Ardelyx’s historical and projected financials preloaded for analysis.
- Customizable Parameters: Adjust WACC, growth rates, and tax assumptions to test various scenarios.
- Financial Statements: Full annual and quarterly breakdowns for deeper insights into Ardelyx’s performance.
- Key Ratios: Built-in analysis for profitability, efficiency, and leverage tailored for Ardelyx, Inc. (ARDX).
- Dashboard with Visual Outputs: Charts and tables for clear, actionable results related to Ardelyx, Inc. (ARDX).
Disclaimer
All information, articles, and product details provided on this website are for general informational and educational purposes only. We do not claim any ownership over, nor do we intend to infringe upon, any trademarks, copyrights, logos, brand names, or other intellectual property mentioned or depicted on this site. Such intellectual property remains the property of its respective owners, and any references here are made solely for identification or informational purposes, without implying any affiliation, endorsement, or partnership.
We make no representations or warranties, express or implied, regarding the accuracy, completeness, or suitability of any content or products presented. Nothing on this website should be construed as legal, tax, investment, financial, medical, or other professional advice. In addition, no part of this site—including articles or product references—constitutes a solicitation, recommendation, endorsement, advertisement, or offer to buy or sell any securities, franchises, or other financial instruments, particularly in jurisdictions where such activity would be unlawful.
All content is of a general nature and may not address the specific circumstances of any individual or entity. It is not a substitute for professional advice or services. Any actions you take based on the information provided here are strictly at your own risk. You accept full responsibility for any decisions or outcomes arising from your use of this website and agree to release us from any liability in connection with your use of, or reliance upon, the content or products found herein.