
|
ASA Gold and Precious Metals Limited (ASA) DCF Valuation |
Fully Editable: Tailor To Your Needs In Excel Or Sheets
Professional Design: Trusted, Industry-Standard Templates
Investor-Approved Valuation Models
MAC/PC Compatible, Fully Unlocked
No Expertise Is Needed; Easy To Follow
ASA Gold and Precious Metals Limited (ASA) Bundle
Streamline your analysis and improve precision with our (ASA) DCF Calculator! Equipped with up-to-date data on ASA Gold and Precious Metals Limited and customizable assumptions, this tool empowers you to forecast, analyze, and value ASA like a seasoned investor.
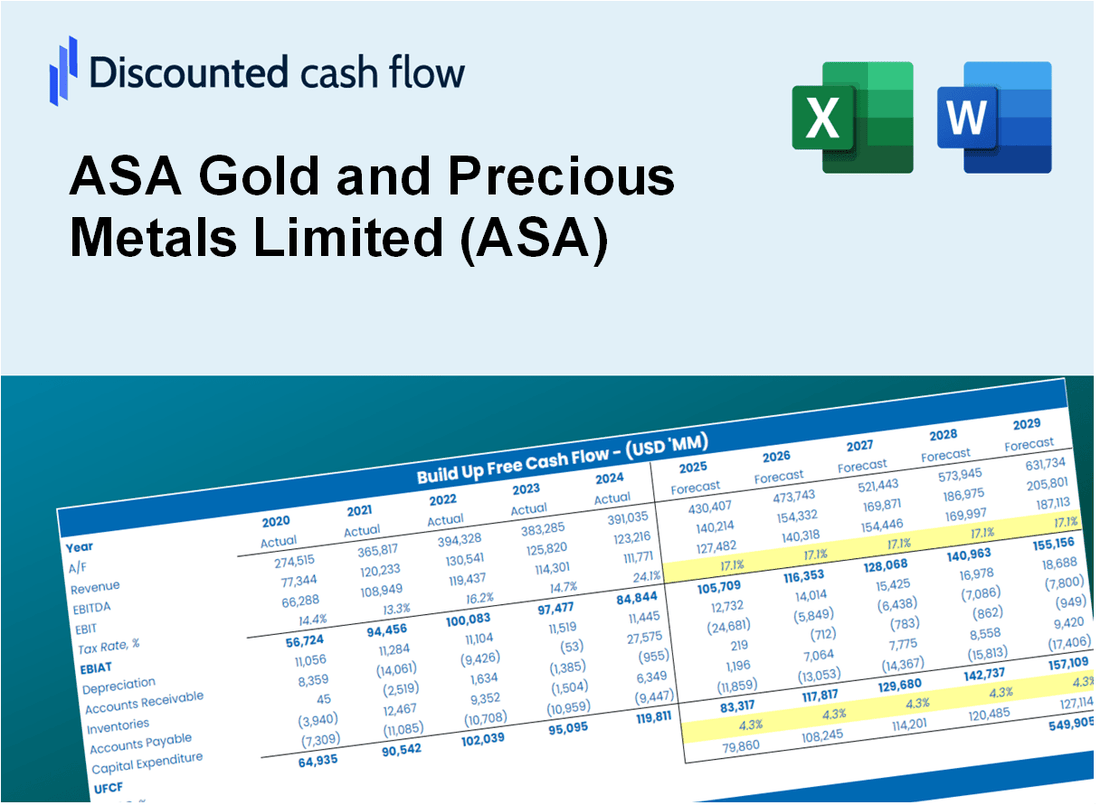
Discounted Cash Flow (DCF) - (USD MM)
| Year | AY1 2020 |
AY2 2021 |
AY3 2022 |
AY4 2023 |
AY5 2024 |
FY1 2025 |
FY2 2026 |
FY3 2027 |
FY4 2028 |
FY5 2029 |
|---|---|---|---|---|---|---|---|---|---|---|
| Revenue | 36.7 | 29.1 | 29.5 | 11.4 | 118.9 | 124.7 | 130.6 | 136.9 | 143.5 | 150.4 |
| Revenue Growth, % | 0 | -20.64 | 1.37 | -61.51 | 947.2 | 4.81 | 4.81 | 4.81 | 4.81 | 4.81 |
| EBITDA | 180.0 | 20.2 | -154.4 | 9.5 | 116.9 | 62.8 | 65.8 | 69.0 | 72.3 | 75.8 |
| EBITDA, % | 490.72 | 69.55 | -523.24 | 84.04 | 98.32 | 50.38 | 50.38 | 50.38 | 50.38 | 50.38 |
| Depreciation | 2.6 | 1.7 | 1.4 | 10.6 | 1.6 | 28.0 | 29.4 | 30.8 | 32.3 | 33.8 |
| Depreciation, % | 7.02 | 5.8 | 4.76 | 93.55 | 1.38 | 22.5 | 22.5 | 22.5 | 22.5 | 22.5 |
| EBIT | 177.4 | 18.6 | -155.8 | -1.1 | 115.3 | 37.7 | 39.5 | 41.4 | 43.4 | 45.5 |
| EBIT, % | 483.7 | 63.76 | -528 | -9.51 | 96.94 | 30.24 | 30.24 | 30.24 | 30.24 | 30.24 |
| Total Cash | 1.3 | .1 | .9 | 4.8 | 4.8 | 13.3 | 13.9 | 14.6 | 15.3 | 16.0 |
| Total Cash, percent | .0 | .0 | .0 | .0 | .0 | .0 | .0 | .0 | .0 | .0 |
| Account Receivables | .2 | .2 | .2 | .3 | .5 | 1.3 | 1.4 | 1.4 | 1.5 | 1.6 |
| Account Receivables, % | 0.48301 | 0.81355 | 0.62304 | 2.89 | 0.43808 | 1.05 | 1.05 | 1.05 | 1.05 | 1.05 |
| Inventories | .0 | .0 | .0 | .0 | .0 | .0 | .0 | .0 | .0 | .0 |
| Inventories, % | 0 | 0 | 0 | 0 | 0 | 0 | 0 | 0 | 0 | 0 |
| Accounts Payable | .0 | .0 | .0 | .0 | .1 | .0 | .0 | .0 | .0 | .0 |
| Accounts Payable, % | 0 | 0 | 0 | 0 | 0.04587855 | 0.00917571 | 0.00917571 | 0.00917571 | 0.00917571 | 0.00917571 |
| Capital Expenditure | .0 | .0 | .0 | .0 | .0 | .0 | .0 | .0 | .0 | .0 |
| Capital Expenditure, % | 0 | 0 | 0 | 0 | 0 | 0 | 0 | 0 | 0 | 0 |
| Tax Rate, % | 0.00000867334 | 0.00000867334 | 0.00000867334 | 0.00000867334 | 0.00000867334 | 0.00000867334 | 0.00000867334 | 0.00000867334 | 0.00000867334 | 0.00000867334 |
| EBITAT | 177.4 | 18.6 | -155.8 | -1.1 | 115.3 | 37.7 | 39.5 | 41.4 | 43.4 | 45.5 |
| Depreciation | ||||||||||
| Changes in Account Receivables | ||||||||||
| Changes in Inventories | ||||||||||
| Changes in Accounts Payable | ||||||||||
| Capital Expenditure | ||||||||||
| UFCF | 179.8 | 20.2 | -154.3 | 9.4 | 116.8 | 64.9 | 68.8 | 72.1 | 75.6 | 79.2 |
| WACC, % | 7.14 | 7.14 | 7.14 | 7.14 | 7.14 | 7.14 | 7.14 | 7.14 | 7.14 | 7.14 |
| PV UFCF | ||||||||||
| SUM PV UFCF | 292.7 | |||||||||
| Long Term Growth Rate, % | 0.50 | |||||||||
| Free cash flow (T + 1) | 80 | |||||||||
| Terminal Value | 1,199 | |||||||||
| Present Terminal Value | 849 | |||||||||
| Enterprise Value | 1,142 | |||||||||
| Net Debt | -5 | |||||||||
| Equity Value | 1,147 | |||||||||
| Diluted Shares Outstanding, MM | 19 | |||||||||
| Equity Value Per Share | 59.68 |
What You Will Get
- Pre-Filled Financial Model: ASA Gold and Precious Metals Limited’s actual data enables precise DCF valuation.
- Full Forecast Control: Adjust revenue growth, margins, WACC, and other key drivers.
- Instant Calculations: Automatic updates ensure you see results as you make changes.
- Investor-Ready Template: A refined Excel file designed for professional-grade valuation.
- Customizable and Reusable: Tailored for flexibility, allowing repeated use for detailed forecasts.
Key Features
- Comprehensive ASA Data: Pre-loaded with ASA Gold and Precious Metals Limited's historical performance and future estimates.
- Customizable Financial Inputs: Modify growth rates, profit margins, discount rates, tax obligations, and capital investments.
- Interactive Valuation Framework: Instant updates to Net Present Value (NPV) and intrinsic value based on your modifications.
- Scenario Analysis: Develop various forecasting scenarios to examine different valuation results.
- Intuitive User Interface: Designed for ease of use, catering to both industry experts and novices.
How It Works
- Download: Obtain the pre-formatted Excel file containing ASA Gold and Precious Metals Limited's (ASA) financial data.
- Customize: Tailor your forecasts, adjusting parameters such as revenue growth, EBITDA %, and WACC.
- Update Automatically: Watch as intrinsic value and NPV calculations refresh in real-time.
- Test Scenarios: Generate various projections and evaluate outcomes instantly.
- Make Decisions: Leverage the valuation results to inform your investment approach.
Why Choose ASA Gold and Precious Metals Limited (ASA)?
- Reliability: Backed by comprehensive market analysis for dependable insights.
- Versatility: Tailored for investors to customize their investment strategies effortlessly.
- Efficiency: Eliminate the complexity of analyzing precious metals investments from the ground up.
- Expert-Level: Crafted with the expertise of industry professionals to ensure high-quality performance.
- Intuitive: Designed for ease of use, accommodating both seasoned investors and newcomers.
Who Should Use This Product?
- Investors: Assess ASA Gold and Precious Metals Limited's (ASA) valuation before making investment decisions.
- CFOs and Financial Analysts: Optimize valuation methodologies and evaluate financial forecasts.
- Mining Company Founders: Understand the valuation processes of established companies like ASA.
- Consultants: Provide comprehensive valuation analyses for clients in the precious metals sector.
- Students and Educators: Utilize industry data to practice and instruct on valuation strategies.
What the Template Contains
- Pre-Filled DCF Model: ASA Gold and Precious Metals Limited’s (ASA) financial data preloaded for immediate use.
- WACC Calculator: Detailed calculations for Weighted Average Cost of Capital tailored for ASA.
- Financial Ratios: Assess ASA’s profitability, leverage, and efficiency metrics.
- Editable Inputs: Modify assumptions like growth, margins, and CAPEX to suit your analysis.
- Financial Statements: Comprehensive annual and quarterly reports to facilitate in-depth analysis.
- Interactive Dashboard: Effortlessly visualize key valuation metrics and outcomes for ASA.
Disclaimer
All information, articles, and product details provided on this website are for general informational and educational purposes only. We do not claim any ownership over, nor do we intend to infringe upon, any trademarks, copyrights, logos, brand names, or other intellectual property mentioned or depicted on this site. Such intellectual property remains the property of its respective owners, and any references here are made solely for identification or informational purposes, without implying any affiliation, endorsement, or partnership.
We make no representations or warranties, express or implied, regarding the accuracy, completeness, or suitability of any content or products presented. Nothing on this website should be construed as legal, tax, investment, financial, medical, or other professional advice. In addition, no part of this site—including articles or product references—constitutes a solicitation, recommendation, endorsement, advertisement, or offer to buy or sell any securities, franchises, or other financial instruments, particularly in jurisdictions where such activity would be unlawful.
All content is of a general nature and may not address the specific circumstances of any individual or entity. It is not a substitute for professional advice or services. Any actions you take based on the information provided here are strictly at your own risk. You accept full responsibility for any decisions or outcomes arising from your use of this website and agree to release us from any liability in connection with your use of, or reliance upon, the content or products found herein.