
|
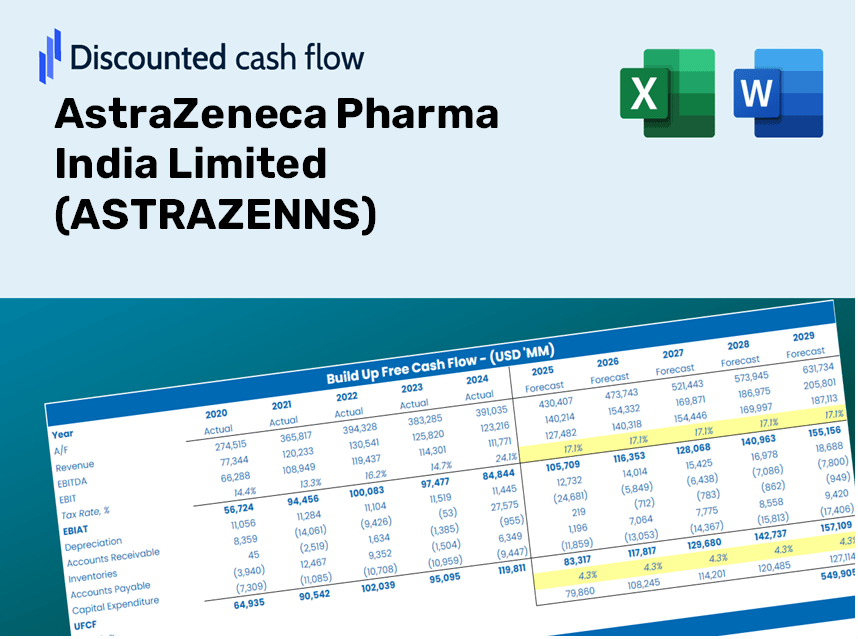
AstraZeneca Pharma India Limited (ASTRAZEN.NS) DCF Valuation |
Fully Editable: Tailor To Your Needs In Excel Or Sheets
Professional Design: Trusted, Industry-Standard Templates
Investor-Approved Valuation Models
MAC/PC Compatible, Fully Unlocked
No Expertise Is Needed; Easy To Follow
AstraZeneca Pharma India Limited (ASTRAZEN.NS) Bundle
Looking to determine the intrinsic value of AstraZeneca Pharma India Limited? Our (ASTRAZENNS) DCF Calculator integrates real-world data with extensive customization features, enabling you to adjust forecasts and enhance your investment choices.
Discounted Cash Flow (DCF) - (USD MM)
| Year | AY1 2021 |
AY2 2022 |
AY3 2023 |
AY4 2024 |
AY5 2025 |
FY1 2026 |
FY2 2027 |
FY3 2028 |
FY4 2029 |
FY5 2030 |
|---|---|---|---|---|---|---|---|---|---|---|
| Revenue | 8,085.6 | 8,056.0 | 10,029.7 | 12,955.3 | 17,162.9 | 20,843.5 | 25,313.5 | 30,742.0 | 37,334.7 | 45,341.2 |
| Revenue Growth, % | 0 | -0.36608 | 24.5 | 29.17 | 32.48 | 21.45 | 21.45 | 21.45 | 21.45 | 21.45 |
| EBITDA | 1,479.3 | 1,009.4 | 1,509.9 | 2,356.8 | 1,978.1 | 3,151.4 | 3,827.2 | 4,648.0 | 5,644.8 | 6,855.3 |
| EBITDA, % | 18.3 | 12.53 | 15.05 | 18.19 | 11.53 | 15.12 | 15.12 | 15.12 | 15.12 | 15.12 |
| Depreciation | 197.5 | 169.5 | 162.6 | 149.4 | 399.9 | 402.3 | 488.6 | 593.4 | 720.6 | 875.2 |
| Depreciation, % | 2.44 | 2.1 | 1.62 | 1.15 | 2.33 | 1.93 | 1.93 | 1.93 | 1.93 | 1.93 |
| EBIT | 1,281.8 | 839.9 | 1,347.3 | 2,207.4 | 1,578.2 | 2,749.1 | 3,338.6 | 4,054.6 | 4,924.1 | 5,980.1 |
| EBIT, % | 15.85 | 10.43 | 13.43 | 17.04 | 9.2 | 13.19 | 13.19 | 13.19 | 13.19 | 13.19 |
| Total Cash | 3,523.4 | 4,484.2 | 5,003.4 | 5,055.7 | 5,525.0 | 9,185.3 | 11,155.2 | 13,547.4 | 16,452.7 | 19,981.0 |
| Total Cash, percent | .0 | .0 | .0 | .0 | .0 | .0 | .0 | .0 | .0 | .0 |
| Account Receivables | 851.9 | 858.9 | 1,183.1 | 1,693.0 | 1,851.8 | 2,370.0 | 2,878.2 | 3,495.4 | 4,245.0 | 5,155.4 |
| Account Receivables, % | 10.54 | 10.66 | 11.8 | 13.07 | 10.79 | 11.37 | 11.37 | 11.37 | 11.37 | 11.37 |
| Inventories | 1,598.0 | 1,402.2 | 1,902.1 | 2,278.8 | 5,485.0 | 4,405.6 | 5,350.4 | 6,497.8 | 7,891.2 | 9,583.5 |
| Inventories, % | 19.76 | 17.41 | 18.96 | 17.59 | 31.96 | 21.14 | 21.14 | 21.14 | 21.14 | 21.14 |
| Accounts Payable | 1,783.7 | 1,904.4 | 2,278.8 | 1,965.1 | 4,563.0 | 4,592.9 | 5,577.8 | 6,774.0 | 8,226.7 | 9,990.9 |
| Accounts Payable, % | 22.06 | 23.64 | 22.72 | 15.17 | 26.59 | 22.03 | 22.03 | 22.03 | 22.03 | 22.03 |
| Capital Expenditure | -77.1 | -96.2 | -85.2 | -107.6 | -17.5 | -163.8 | -198.9 | -241.6 | -293.4 | -356.4 |
| Capital Expenditure, % | -0.95355 | -1.19 | -0.84948 | -0.83055 | -0.10196 | -0.78594 | -0.78594 | -0.78594 | -0.78594 | -0.78594 |
| Tax Rate, % | 25.98 | 25.98 | 25.98 | 25.98 | 25.98 | 25.98 | 25.98 | 25.98 | 25.98 | 25.98 |
| EBITAT | 941.0 | 623.0 | 997.6 | 1,623.9 | 1,168.2 | 2,030.1 | 2,465.4 | 2,994.1 | 3,636.2 | 4,416.0 |
| Depreciation | ||||||||||
| Changes in Account Receivables | ||||||||||
| Changes in Inventories | ||||||||||
| Changes in Accounts Payable | ||||||||||
| Capital Expenditure | ||||||||||
| UFCF | 395.2 | 1,005.8 | 625.3 | 465.4 | 783.5 | 2,859.7 | 2,287.0 | 2,777.4 | 3,373.1 | 4,096.4 |
| WACC, % | 4.53 | 4.53 | 4.53 | 4.53 | 4.53 | 4.53 | 4.53 | 4.53 | 4.53 | 4.53 |
| PV UFCF | ||||||||||
| SUM PV UFCF | 13,367.7 | |||||||||
| Long Term Growth Rate, % | 4.00 | |||||||||
| Free cash flow (T + 1) | 4,260 | |||||||||
| Terminal Value | 801,344 | |||||||||
| Present Terminal Value | 642,066 | |||||||||
| Enterprise Value | 655,434 | |||||||||
| Net Debt | -5,004 | |||||||||
| Equity Value | 660,438 | |||||||||
| Diluted Shares Outstanding, MM | 25 | |||||||||
| Equity Value Per Share | 26,419.64 |
What You Will Receive
- Pre-Filled Financial Model: Utilize AstraZeneca Pharma India Limited’s actual data for accurate DCF valuation.
- Complete Forecast Control: Modify key parameters such as revenue growth, profit margins, WACC, and more.
- Real-Time Calculations: Experience automatic updates that showcase results instantly as you make adjustments.
- Professional-Grade Template: An elegant Excel file specifically crafted for high-quality valuation presentations.
- Flexible and Reusable: Designed for adaptability, allowing for continuous use in various detailed forecasts.
Key Features
- Real-Life ASTRAZENNS Data: Pre-loaded with AstraZeneca Pharma India Limited’s historical financial performance and future growth projections.
- Completely Customizable Inputs: Modify revenue growth rates, profit margins, WACC, tax rates, and capital expenditures to suit your analysis.
- Dynamic Valuation Model: Instant updates to Net Present Value (NPV) and intrinsic value reflective of your customized inputs.
- Scenario Analysis: Develop various forecast scenarios to explore a range of valuation possibilities.
- User-Friendly Interface: Intuitive design that caters to both industry experts and newcomers alike.
How It Works
- 1. Access the Template: Download and open the Excel file containing AstraZeneca Pharma India Limited's (ASTRAZENNS) preloaded data.
- 2. Adjust Assumptions: Modify essential inputs such as growth rates, WACC, and capital expenditures.
- 3. Instant Results: The DCF model calculates intrinsic value and NPV in real-time.
- 4. Experiment with Scenarios: Analyze various forecasts to evaluate different valuation outcomes.
- 5. Present with Assurance: Share professional valuation insights to bolster your decision-making.
Why Opt for This Calculator?
- All-in-One Solution: Features DCF, WACC, and financial ratio analyses seamlessly integrated.
- Flexible Inputs: Modify the yellow-highlighted cells to explore different scenarios.
- In-Depth Analysis: Automatically computes AstraZeneca's intrinsic value and Net Present Value.
- Data Ready: Comes with historical and projected data for precise baseline calculations.
- Expert Level: Perfect for financial analysts, investors, and business advisors.
Who Should Utilize This Product?
- Investors: Accurately assess AstraZeneca Pharma India Limited’s (ASTRAZENNS) fair value prior to making investment choices.
- CFOs: Utilize a sophisticated DCF model for financial reporting and analysis purposes.
- Consultants: Easily customize the template for valuation reports tailored for clients.
- Entrepreneurs: Acquire knowledge of financial modeling techniques employed by leading pharmaceutical firms.
- Educators: Employ it as a pedagogical resource to illustrate valuation methodologies.
What the Template Contains
- Historical Data: Provides AstraZeneca Pharma India Limited’s (ASTRAZENNS) previous financial performance and foundational forecasts.
- DCF and Levered DCF Models: Comprehensive templates to determine AstraZeneca’s intrinsic value.
- WACC Sheet: Ready-to-use calculations for Weighted Average Cost of Capital.
- Editable Inputs: Adjust vital parameters such as growth rates, EBITDA %, and CAPEX assumptions.
- Quarterly and Annual Statements: Detailed analysis of AstraZeneca’s financial data.
- Interactive Dashboard: Dynamically visualize valuation outcomes and projections.
Disclaimer
All information, articles, and product details provided on this website are for general informational and educational purposes only. We do not claim any ownership over, nor do we intend to infringe upon, any trademarks, copyrights, logos, brand names, or other intellectual property mentioned or depicted on this site. Such intellectual property remains the property of its respective owners, and any references here are made solely for identification or informational purposes, without implying any affiliation, endorsement, or partnership.
We make no representations or warranties, express or implied, regarding the accuracy, completeness, or suitability of any content or products presented. Nothing on this website should be construed as legal, tax, investment, financial, medical, or other professional advice. In addition, no part of this site—including articles or product references—constitutes a solicitation, recommendation, endorsement, advertisement, or offer to buy or sell any securities, franchises, or other financial instruments, particularly in jurisdictions where such activity would be unlawful.
All content is of a general nature and may not address the specific circumstances of any individual or entity. It is not a substitute for professional advice or services. Any actions you take based on the information provided here are strictly at your own risk. You accept full responsibility for any decisions or outcomes arising from your use of this website and agree to release us from any liability in connection with your use of, or reliance upon, the content or products found herein.