
|
ASE Technology Holding Co., Ltd. (ASX): PESTLE Analysis [Nov-2025 Updated] |
Fully Editable: Tailor To Your Needs In Excel Or Sheets
Professional Design: Trusted, Industry-Standard Templates
Investor-Approved Valuation Models
MAC/PC Compatible, Fully Unlocked
No Expertise Is Needed; Easy To Follow
ASE Technology Holding Co., Ltd. (ASX) Bundle
You're looking for a clear, actionable breakdown of the forces shaping ASE Technology Holding Co., Ltd. (ASX) right now. My two decades in this business, including my time analyzing companies like BlackRock, tell me the PESTLE framework is defintely the right tool. The near-term story for ASE is all about leveraging their advanced packaging dominance against a volatile geopolitical backdrop. They're making money-Q3 2025 net income surged 45% sequentially-but they're also taking on debt to fund the AI-driven tech race. Here is the analysis, grounded in late 2025 data.
The political environment is a high-stakes game of chess for ASE. The US CHIPS Act and Europe's Chips Act are clear signals: governments want to on-shore semiconductor production. This creates long-term competition, but for now, the US-China geopolitical tension is forcing customers to diversify their supply chains, which actually benefits ASE's global footprint.
Customers aren't just waiting; they are actively building secure inventory to minimize the impact of potential trade tariff volatility. This boosts near-term demand. Still, the core, unquantifiable risk remains Taiwan's political stability, as that is where the headquarters and primary operations are. You can't hedge against that risk with a simple derivative.
The numbers look strong, but they tell a story of aggressive growth fueled by debt. Q3 2025 net revenues hit NT$168,569 million, a solid 5.3% year-over-year jump. More impressively, net income attributable to shareholders surged to NT$10,870 million in Q3 2025-a massive 45% sequential increase. That's pure momentum.
Here's the quick math on the risk: that growth requires aggressive capital expenditure to fund AI capacity, pushing the net debt-to-equity ratio to 63% as of Q3 2025. They are betting big on the global semiconductor market's projected 11% growth in 2025, which is mostly driven by AI and data centers. It's a high-leverage play.
The human side of the chip business is critical. There is a persistent talent gap in the semiconductor industry, which means ASE has to pour heavy investment into human capital development just to keep capacity running. It's not a nice-to-have; it's an operational necessity.
Plus, increasing societal demand for corporate social responsibility (CSR) pushes for transparent Environmental, Social, and Governance (ESG) reporting-investors are watching this closely. The focus on an inclusive workplace and employee well-being is now a core corporate sustainability strategy. Honestly, smart manufacturing initiatives are as much about enhancing workplace safety as they are about operational efficiency.
This is ASE's biggest opportunity. The surging demand for advanced packaging-like CoWoS, 3.5D, and Fan-Out Panel Level Packaging (FOPLP)-is driven almost entirely by the insatiable needs of Artificial Intelligence (AI) and High-Performance Computing (HPC). This isn't a niche market anymore.
Their Leading-Edge Advanced Packaging (LEAP) services grew to 10% of Q1 2025 Assembly, Test, and Materials (ATM) revenues, up sharply from 6% in 2024. This is a key metric. Also, strategic outsourcing of advanced packaging orders from Taiwan Semiconductor Manufacturing Company (TSMC) is a huge tailwind for their ATM revenue. They are even using AI to optimize machine scheduling and water operations in their smart factories.
The regulatory landscape is getting tighter, particularly around disclosure. Mandatory adoption of the new IFRS Sustainability Disclosure Standards (IFRS S1 and S2) by Taiwan's Financial Supervisory Commission (FSC) requires new, complex financial disclosures. This is a material change for their reporting structure.
Beyond finance, strict compliance with international standards and local environmental laws is required across all global operations. They are also increasing focus on safeguarding Intellectual Property (IP), including adopting trade secret registry systems, which is smart. Plus, continuous review and strengthening of information security policies is a must against the rising geopolitical cyberattack risks.
Environmental commitments are now a cost of doing business and a source of competitive advantage. ASE's amended Environmental Responsibility Policy from July 2025 commits to Low Carbon and Circular strategies. They are aligning with Science Based Targets initiative (SBTi) net-zero goals through pledges to improve energy efficiency and reduce greenhouse gas emissions.
Water management is crucial for water-intensive chip production, so the focus on wastewater recycling and monitoring is non-negotiable. They are implementing internal carbon pricing to boost carbon reduction efforts across subsidiaries. This makes carbon reduction an internal financial decision, not just an external mandate.
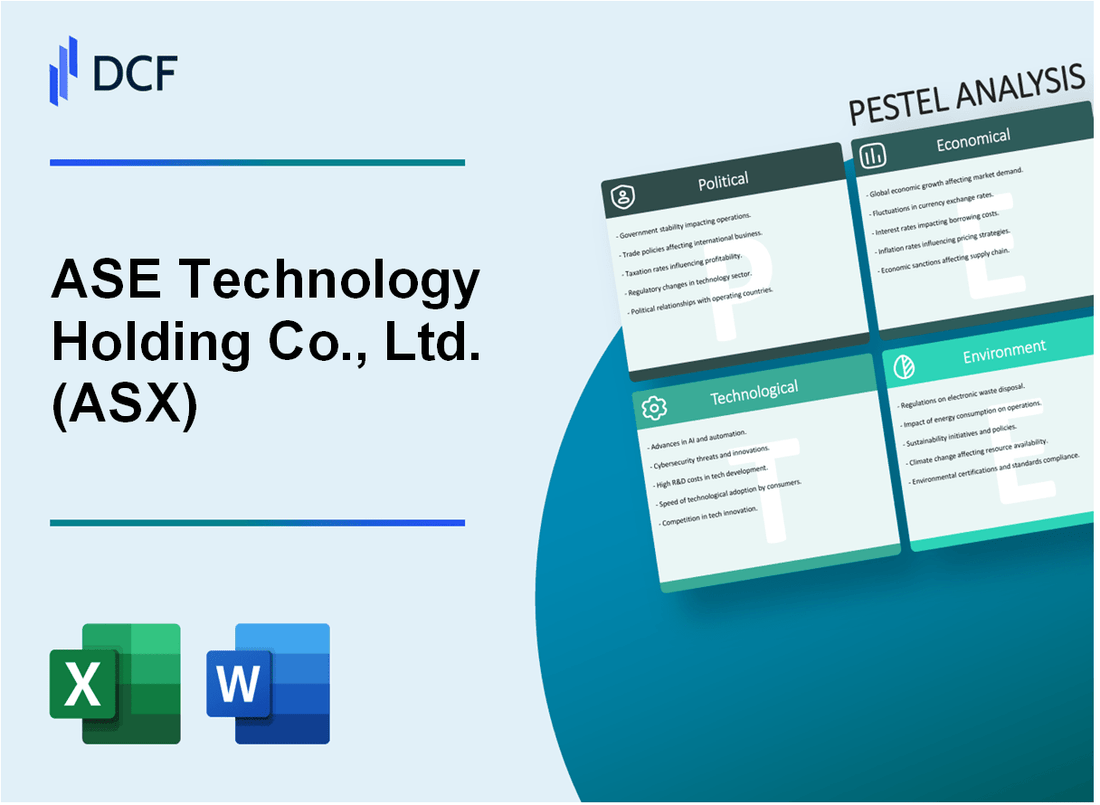
ASE Technology Holding Co., Ltd. (ASX) - PESTLE Analysis: Political factors
US CHIPS Act and Europe's Chips Act Promote Onshoring, Creating Long-Term Competition
You need to understand that major government legislation like the US CHIPS and Science Act and the European Chips Act fundamentally changes the long-term competitive landscape for a company like ASE Technology Holding. These acts aren't just subsidies; they are a strategic push for regional self-sufficiency, which translates directly into onshoring competition for outsourced semiconductor assembly and test (OSAT) services.
The US Act, with its $52.7 billion in total funding, allocates $39 billion specifically for manufacturing incentives, plus a 25% investment tax credit for new equipment and facilities. Similarly, the European Chips Act earmarks approximately €43 billion in public and private funds to double the EU's global market share to 20% by 2030. This is a clear signal: the US and Europe want more chip production, including advanced packaging, built on their soil. This creates a long-term headwind, forcing ASE to invest in less cost-effective regions to maintain customer access.
Geopolitical Tensions (US-China) Drive Supply Chain Diversification, Benefiting ASE's Global Footprint
The US-China geopolitical friction is the single biggest near-term driver of capital expenditure and supply chain shifts in the semiconductor industry. For ASE Technology Holding, this tension is a net opportunity because of its existing global footprint and its strategy of 'China+1.' The company garners over half its sales from firms in the United States, making compliance and proximity to North American customers critical.
ASE is actively responding to this fragmentation by expanding capacity outside of Taiwan and China. This is not a slow pivot; it's a major capital reallocation, including the launch of its fifth plant in Penang, Malaysia in February 2025, which will expand the facility's floor space from 1 million to 3.4 million square feet. Plus, to better serve key North American AI customers, ASE is expanding its high-end chip testing fab in San Jose, California. The company is also scouting sites in Japan and Mexico, having acquired land in Tonala, Mexico, for an automotive electronics supply chain. This is how you hedge risk.
- ASE's Q3 2025 consolidated net revenues hit NT$168.57 billion (approximately $5.66 billion USD).
- ASE sold four packaging plants in China while expanding in Malaysia and Taiwan, clearly demonstrating the strategic shift.
Customers Are Building Secure Inventory to Minimize Potential Trade Tariff Volatility
The constant threat of new tariffs-like the 25% duty on Chinese imports announced in February 2025-is making customers nervous. This political uncertainty translates directly into inventory management decisions. Companies are moving away from just-in-time logistics to a just-in-case model, building inventory buffers to mitigate potential cost spikes from trade tariff volatility or supply chain disruptions.
We see this trend clearly in the ecosystem. For example, a major semiconductor equipment supplier, Applied Materials, saw its Days Inventory Outstanding (DIO) rise to 152 days in Q3 2025, which is 13 days above its five-year average. This inventory build-up by customers, while potentially creating short-term revenue pull-ins for OSAT providers like ASE, is defintely a risk to demand visibility in the mid-term. About 33% of businesses in the Asia Pacific region are creating parallel supply chains to avoid geopolitical disruptions, a trend that directly benefits ASE's diversified manufacturing locations.
Taiwan's Political Stability Remains a Core, Unquantifiable Risk
The single most critical, unquantifiable risk is the political stability of Taiwan, where ASE Technology Holding is headquartered (Kaohsiung) and maintains a significant portion of its primary operations. While the company is actively investing on the island-initiating construction on a new K18B factory in the Nanzi Science Park with a US$217 million investment-this concentration remains an existential threat.
The political gridlock between Taiwan's Democratic Progressive Party (DPP) and the opposition parties (Kuomintang and Taiwan People's Party) adds domestic policy uncertainty, but the cross-strait tension with China is the true Sword of Damocles. Analysts estimate a full-scale conflict could trigger a $10 trillion global economic shock. While the risk probability is unquantifiable, the impact is catastrophic. This is why the diversification strategy, despite being more expensive, is non-negotiable for long-term survival.
| Political/Geopolitical Factor | Impact on ASE Technology Holding | Quantifiable Data (FY 2025) |
|---|---|---|
| US/EU Chips Acts (Onshoring) | Long-term competitive pressure; forces capital expenditure in high-cost regions. | US CHIPS Act: $52.7 billion funding; EU Chips Act: €43 billion funding. |
| US-China Tensions (Diversification) | Immediate opportunity to capture 'China+1' demand and secure US customer revenue. | ASE expanded Malaysia facility from 1M to 3.4M square feet. Over 50% of sales from US firms. |
| Trade Tariff Volatility | Drives customer inventory-building, creating short-term demand but mid-term demand visibility risk. | Applied Materials DIO rose to 152 days in Q3 2025, 13 days above 5-year average. |
| Taiwan Political Stability | Core, unquantifiable risk to headquarters and primary operations. | ASE invested US$217 million in new K18B factory in Kaohsiung. Potential global economic shock of $10 trillion. |
ASE Technology Holding Co., Ltd. (ASX) - PESTLE Analysis: Economic factors
Strong Q3 2025 net revenues of NT$168,569 million, up 5.3% year-over-year.
You're seeing the semiconductor market's recovery clearly reflected in ASE Technology Holding Co., Ltd.'s recent financials. The company reported consolidated net revenues of NT$168,569 million for the third quarter of 2025, which is a solid 5.3% increase from the same period last year. This growth is a direct result of strong demand in their core business, the Assembly, Testing, and Material (ATM) segment, which saw its revenue jump by 16.9% year-over-year in Q3 2025. The Electronic Manufacturing Services (EMS) side, while a bit softer, still contributed significantly.
Here's the quick math on where the revenue is coming from, showing the ATM business is the engine right now:
| Segment | Q3 2025 Net Revenues (NT$ Million) | % of Total Revenue | Year-over-Year Growth (YoY) |
|---|---|---|---|
| ATM (Assembly, Testing, Material) | NT$100,289 million | 47% | +16.9% |
| EMS (Electronic Manufacturing Services) | NT$69,022 million | 41% | -8.4% |
| Consolidated Total | NT$168,569 million | 100% | +5.3% |
The sequential growth was even stronger, with total net revenues up 11.8% from Q2 2025, meaning the momentum is building as the year progresses. That's a defintely positive sign for the near-term outlook.
Net income attributable to shareholders hit NT$10,870 million in Q3 2025, a 45% sequential jump.
The real highlight for investors is the bottom line. Net income attributable to shareholders for Q3 2025 reached NT$10,870 million. This wasn't just a small bump; it was a massive 45% sequential jump from the NT$7,521 million reported in Q2 2025. This dramatic increase shows that the higher revenue is translating efficiently into profit, a key measure of operational leverage. The basic earnings per share (EPS) for the quarter was NT$2.50, up from NT$1.74 in the prior quarter.
This profit surge is largely driven by the high-margin advanced packaging and testing services, especially those related to Artificial Intelligence (AI) and High-Performance Computing (HPC) applications. The gross margin for the quarter improved slightly to 17.1%, and the operating margin hit 7.8%, showing better cost control and pricing power in those specialized areas. The demand for advanced packaging is simply through the roof.
Aggressive capital expenditure to fund AI capacity has pushed net debt-to-equity to 63% as of Q3 2025.
To capture the AI-driven market opportunity, ASE Technology Holding Co., Ltd. is spending big on capital expenditure (CapEx), which is impacting its balance sheet. The company's net debt-to-equity ratio stood at 0.63 (or 63%) as of September 30, 2025. While this isn't an alarming number for a capital-intensive industry, it reflects the aggressive investment strategy. The company is accelerating its machine and equipment investments, with a plan to add between US$300 million to US$400 million to its already substantial CapEx budget of US$2.5 billion for 2025.
This huge spending is focused on advanced packaging technologies like 2.5D and 3D integration, crucial for AI accelerators and high-bandwidth memory (HBM). What this estimate hides is the long-term benefit: securing a leading position in the fastest-growing segment of the semiconductor market. Total CapEx for 2025 is even projected by some institutional investors to exceed US$6 billion, underscoring the scale of the commitment to future capacity.
The CapEx breakdown in Q3 2025 alone was substantial:
- Packaging operations: US$534 million
- Testing operations: US$199 million
- EMS operations: US$40 million
Global semiconductor market is projected to grow by 11% in 2025, driven by AI and data centers.
The macro environment is a tailwind, not a headwind. The global semiconductor market is forecasted to reach sales of $700.9 billion in 2025, which represents a strong year-over-year growth of 11.2%, according to the Semiconductor Industry Association (SIA) and World Semiconductor Trade Statistics (WSTS). Other forecasts, like one from IDC, are even more bullish, projecting worldwide semiconductor revenue to reach $800 billion in 2025, growing 17.6% year-over-year. This is a massive market expansion.
The growth is overwhelmingly driven by two key areas that directly benefit ASE Technology Holding Co., Ltd.:
- Generative AI and Accelerated Computing: AI-related chips, including GPUs, HBM, and advanced packaging, are expected to generate approximately $150 billion in sales this year.
- Data Center Infrastructure: Hyperscale data center buildouts continue to fuel demand for high-performance processors and networking semiconductors.
For ASE Technology Holding Co., Ltd., which specializes in the advanced packaging required for these complex AI chips, this economic climate is a clear opportunity. They are positioned at the bottleneck of the AI supply chain, which means they can command better pricing and utilization rates for their leading-edge capacity. The industry is accelerating toward the $1 trillion mark, and ASE is spending to be a central player in that future.
ASE Technology Holding Co., Ltd. (ASX) - PESTLE Analysis: Social factors
You're operating in a fiercely competitive semiconductor market, so the social factors-specifically, your human capital strategy-are a direct lever on your operational risk and innovation pipeline. For ASE Technology Holding Co., Ltd., the focus is rightly on talent retention, inclusive growth, and transparent social governance, all backed by concrete investment and automation.
Persistent talent gap in the semiconductor industry requires heavy investment in human capital development.
The global race for advanced packaging capacity, especially for AI chips, has intensified the talent shortage, making human capital a critical constraint for ASE Technology Holding Co., Ltd.. The company is responding with significant investment in development, not just recruitment. In 2024, the total spent on employee training exceeded US$7.9 million, with each employee completing an average of 90.0 training hours. This heavy investment is essential for upskilling the workforce to manage complex advanced packaging technologies.
To secure its leadership, ASE Technology Holding Co., Ltd. is focused on retaining and growing its existing talent pool. In 2024, 64.1% of available job vacancies were filled internally, and approximately 85.5% of the company's management ranks are internal promotions. This internal focus is a smart, defintely sustainable way to manage the talent gap. The company's global workforce stood at 100,450 employees as of June 30, 2025.
| Human Capital Metric | 2024/2025 Data | Significance |
|---|---|---|
| Total Employees (Q2 2025) | 100,450 | Scale of the global workforce. |
| Total Training Hours (2024) | Over 7.57 million | Commitment to continuous upskilling. |
| Average Training Hours per Employee (2024) | 90.0 hours | High per-capita investment in knowledge. |
| Employee Bonuses (2024) | US$352 million | A clear financial tool for talent attraction and retention. |
Focus on an inclusive workplace and employee well-being as a core corporate sustainability strategy.
An inclusive workplace is now a non-negotiable part of corporate sustainability, and ASE Technology Holding Co., Ltd. has made it one of its four strategic pillars: Low Carbon, Circular, Inclusive, and Collaborative. This focus helps attract diverse talent in a male-dominated industry. For example, over 6,000 female employees hold STEM-related positions, representing 18.3% of that demographic, and women hold nearly 29.7% of management positions.
The company also actively works on social inclusion beyond gender. In 2024, the company hired 644 persons with disabilities. Plus, they're using data analytics to proactively manage attrition risks, especially among new hires. Employee well-being is addressed through a comprehensive leave management system and a focus on occupational health and safety (OHS) management.
Increasing societal demand for corporate social responsibility (CSR) pushes for transparent ESG reporting.
Stakeholder pressure for environmental, social, and governance (ESG) transparency is intensifying, moving reporting from voluntary disclosure to a regulatory requirement. ASE Technology Holding Co., Ltd. is ahead of the curve, preparing for mandatory compliance with the new International Financial Reporting Standards (IFRS) Sustainability Disclosure Standards (IFRS S1 and S2).
This is a major step toward financial-grade social data. The Chief Financial Officer (CFO) and Chief Sustainability Officer (CSO) were appointed in 2024 to lead this adoption, establishing a cross-functional task force to ensure data credibility and compliance. This means you'll be seeing more consistent, comparable social metrics in future reports.
- Adopting IFRS S1 and S2 standards for sustainability disclosure.
- ESG strategy is led by the CFO and CSO since 2024.
- Established ASE Social Enterprise Co., Ltd. to advance social inclusion.
Smart manufacturing initiatives aim to enhance workplace safety and operational efficiency.
The drive for efficiency through smart manufacturing (Industry 4.0) is directly tied to improving workplace safety. ASE Technology Holding Co., Ltd. uses artificial intelligence (AI) and automation to remove human workers from hazardous or repetitive tasks, which is a clear win for OHS. The company operates 46 lights-out factories, which are highly automated facilities.
To embed safety into its core operations, ASE Technology Holding Co., Ltd. published the 'White Paper on Packaging and Testing Machine Safety' in 2023, a first for the semiconductor packaging and testing industry, demonstrating a collaborative approach to setting industry safety standards. The company has also trained more than 700 automation and AI-related professionals to manage these advanced systems, ensuring the human element is focused on higher-value, safer work.
ASE Technology Holding Co., Ltd. (ASX) - PESTLE Analysis: Technological factors
The technological landscape for ASE Technology Holding Co., Ltd. (ASX) in 2025 is defined by an intense, AI-driven shift toward advanced packaging, which is now the primary bottleneck and growth driver in the semiconductor industry. This is a massive tailwind, but it requires relentless capital expenditure (CapEx) and flawless execution.
Surging demand for advanced packaging (CoWoS, 3.5D, FOPLP) is driven by AI and High-Performance Computing (HPC)
The core of ASE's technological opportunity is the explosive demand for advanced packaging (AP) solutions like Chip-on-Wafer-on-Substrate (CoWoS), 3.5D integration, and Fan-Out Panel Level Packaging (FOPLP). This surge is directly tied to the need for higher bandwidth and power efficiency in Artificial Intelligence (AI) and High-Performance Computing (HPC) chips, specifically for major clients like NVIDIA and AMD. For the first time, the dollar value of advanced packaging solutions surpassed that of traditional packaging in 2025, capturing a market share of 51.3%.
This market dynamic is a huge advantage for ASE, which is one of the few Outsourced Semiconductor Assembly and Test (OSAT) firms with the scale and technology to meet this demand. The need for chiplet architectures (integrating multiple components into one package) is making 2.5D and 3D packaging essential, a trend that is synergistic with ASE's core competencies. The company's expansion into new technologies like Co-packaged Optics (CPO) further solidifies its position at the forefront of this technological evolution.
Leading-edge advanced packaging (LEAP) services grew to 10% of Q1 2025 ATM revenues, up from 6% in 2024
The financial impact of this technological shift is clearly visible in the Advanced Packaging, Testing, and Materials (ATM) segment. Leading-Edge Advanced Packaging (LEAP) services-which include the most complex, high-margin technologies-have become a significantly larger portion of the ATM business. For the first quarter of 2025, LEAP services accounted for 10% of ASE's total ATM revenues, a substantial jump from 6% for the full year 2024. This growth is a clear indicator that the company's multi-billion-dollar CapEx investments are paying off.
Here's the quick math on the LEAP segment's growing importance:
| Metric | Full Year 2024 | Q1 2025 | Full Year 2025 (Target) |
|---|---|---|---|
| LEAP % of ATM Revenue | 6% | 10% | N/A |
| ATM Revenue (Q1 2025) | N/A | NT$86.7 billion | N/A |
| LEAP & Testing Revenue (USD) | ~US$600 million | N/A | >US$1.6 billion |
| Projected Revenue Increase (2025) | N/A | N/A | +US$1 billion |
Management projects that leading-edge advanced packaging and testing revenue will more than double in 2025, reaching over $1.6 billion. That's a huge step-up in high-value services.
Strategic outsourcing of advanced packaging orders from Taiwan Semiconductor Manufacturing Company (TSMC) bolsters ATM revenue
A critical technological and strategic opportunity is the partnership with Taiwan Semiconductor Manufacturing Company (TSMC), the world's leading foundry. Due to the overwhelming demand for AI chips, TSMC's internal CoWoS capacity has become a major supply bottleneck. To alleviate this, TSMC is strategically outsourcing a significant portion of its CoWoS-S on-Substrate (oS) backend process to OSAT partners like ASE and its subsidiary, Siliconware Precision Industries (SPIL).
This is a defintely a game-changer. Industry sources suggest that ASE may handle between 40% and 50% of TSMC's outsourced CoWoS-S oS packaging by 2025. This collaboration not only provides a massive, high-volume revenue stream but also validates ASE's technological prowess in a segment previously exclusive to the foundry. One customer, highly likely TSMC, accounted for more than 10% of ASE's ATM revenues in Q3 2025, demonstrating the scale of this strategic relationship.
Use of AI and collaborative computations to optimize machine scheduling and water operations in smart factories
Beyond packaging the world's most advanced chips, ASE is using technology internally to drive operational efficiency and sustainability. The company's smart factory initiative, which includes 46 lights-out factories, leverages AI and collaborative computations to optimize complex manufacturing processes. This is how you maintain margins in a high-volume, high-mix environment.
Key AI applications in the smart factories include:
- Machine and Shipment Scheduling: Applying AI to optimize production schedules and meet delivery deadlines, ensuring the most efficient use of equipment.
- Wastewater Management: Utilizing AI-driven wastewater management systems to enhance efficiency and reduce resource consumption, a crucial factor in water-intensive semiconductor manufacturing.
- Predictive Maintenance: Using AI to analyze sensor data and predict equipment failures, allowing for proactive maintenance and minimizing unplanned downtime.
The company's Kaohsiung bumping facility was inducted into the World Economic Forum's Global Lighthouse Network, a clear external validation of its success in integrating Fourth Industrial Revolution (4IR) technologies. This focus on automation and AI-driven efficiency is necessary to keep costs down and yields high, especially as advanced packaging complexity rises.
ASE Technology Holding Co., Ltd. (ASX) - PESTLE Analysis: Legal factors
Mandatory adoption of IFRS Sustainability Disclosure Standards (IFRS S1 and S2) by Taiwan's FSC requires new financial disclosures
You need to be ready for a significant shift in financial reporting, even before the official deadline. Taiwan's Financial Supervisory Commission (FSC) has mandated the phased adoption of the International Financial Reporting Standards (IFRS) Sustainability Disclosure Standards (IFRS S1 and IFRS S2), which means sustainability is now a legal disclosure requirement, not just a voluntary report.
As a large-cap company, ASE Technology Holding Co., Ltd. falls into Phase I of the FSC's roadmap. This requires them to compile their sustainability information for the Fiscal Year 2026 and report it in 2027. However, the preparation is happening right now in 2025. The FSC's threshold for Phase I is listed companies with capital over NT$10 billion (New Taiwan Dollars). Given ASE Technology Holding Co., Ltd.'s market capitalization was approximately $21.89 billion as of February 2025, they are defintely in the first wave. The 2025 focus is on building the internal systems and data collection processes, which includes disclosing carbon emission data (Scope 1, 2, and 3) and setting a clear carbon neutrality roadmap.
| FSC IFRS S1/S2 Roadmap Phase | Capital Threshold | First Reporting Year (on prior FY data) |
|---|---|---|
| Phase I (ASE Technology Holding Co., Ltd.) | Over NT$10 billion | 2027 (on FY2026 data) |
| Phase II | NT$5 billion to NT$10 billion | 2028 (on FY2027 data) |
| Phase III | All other listed companies | 2029 (on FY2028 data) |
Strict compliance with international standards and local environmental laws is required across all global operations
Operating a global manufacturing and testing network means navigating a patchwork of environmental laws, and the legal risk from non-compliance is material. ASE Technology Holding Co., Ltd. has a stated commitment to strict compliance with all applicable laws and regulations in every location they operate.
Their Environmental Responsibility Policy was formally amended in July 2025, underscoring a commitment to international standards and local environmental laws. This isn't just a paper exercise; the company faces the ongoing risk of administrative penalties and criminal charges related to alleged environmental violations, which is a constant line item in their risk disclosure. They are actively using sophisticated tools to manage this risk.
- Use the TNFD-LEAP (Taskforce on Nature-related Financial Disclosures) method to assess nature-related risks at major global facilities.
- Require subsidiaries to promptly report all corrective actions and penalties via management systems.
- Implement root cause analysis and improvement plans for any regulatory compliance incidents.
The legal risk is that a single environmental violation in a key manufacturing hub can lead to operational disruption and significant financial liabilities, so compliance systems must be flawless.
Increased focus on safeguarding intellectual property (IP), including adopting trade secret registry systems
In the high-stakes semiconductor industry, IP is the core of the business model, and legal protections are constantly being strengthened to fend off technology theft. ASE Technology Holding Co., Ltd. has an explicit IP Management Policy that aligns with R&D and operations to protect critical technologies and ensure freedom of operation.
The focus has tightened on trade secrets, which are often the most vulnerable assets in a global supply chain. The company has adopted a policy for the protection of national core technologies and trade secrets to enhance law compliance. This is a direct response to rising geopolitical and economic espionage risks.
- Maintain a 3-pronged approach to IP: developing a comprehensive patent portfolio, re-assessing patents for value, and revitalization to increase value.
- Ensure the Supplier Code of Conduct, updated in July 2025, mandates that technology and know-how transfer must protect IP rights.
- Utilize a robust IP application system to transform R&D achievements into legally protected rights.
Protecting a patent portfolio that underpins a business with a $21.89 billion market cap requires a proactive and legally rigorous strategy.
Continuous review and strengthening of information security policies against rising geopolitical cyberattack risks
Cybersecurity risk is now a top-tier legal and governance issue, especially for a company involved in the global semiconductor supply chain that is a target for state-sponsored actors. ASE Technology Holding Co., Ltd. recognized this by issuing an updated Information Security Policy in July 2025.
The company's governance structure reflects the severity of the threat, establishing the 'Sustainable Development and Information Security Committee' as the highest governing body for this issue. Senior management is committed to the continuous allocation of resources to upgrade infrastructure and adopt new defense technologies. While a specific cybersecurity budget isn't public, the overall capital expenditures (CapEx) for equipment totaled US$992 million in the second quarter of 2025, a significant pool of investment that includes the necessary IT infrastructure upgrades.
Key actions to strengthen the legal and operational defense include:
- Establishing a formal incident reporting and response procedure to actively monitor and immediately counter threats.
- Stipulating information security maturity requirements for all suppliers and external partners.
- Ensuring the confidentiality, integrity, and availability of information assets through a comprehensive management system.
A major breach could trigger significant legal liabilities from customers and regulators, so the July 2025 policy update is a critical legal defense mechanism.
ASE Technology Holding Co., Ltd. (ASX) - PESTLE Analysis: Environmental factors
You're looking for a clear-eyed view of environmental risk and opportunity at ASE Technology Holding Co., Ltd., and the picture is one of aggressive, quantified commitment. The core takeaway is that the company has moved past mere compliance to integrate Low Carbon and Circular strategies directly into its financial and operational planning, which is defintely a necessary move in the semiconductor space.
Amended Environmental Responsibility Policy (July 2025) commits to Low Carbon and Circular strategies
ASE Technology Holding Co., Ltd. (ASEH) formalized its long-term vision by amending its Environmental Responsibility Policy in July 2025. This policy, approved by the Board of Directors, is built upon four major sustainable strategies: Low Carbon, Circular, Inclusive, and Collaborative. This isn't just a mission statement; it's the foundation for regulating environmental management across all business interactions, from suppliers to customers. The commitment is to eco-efficiency, meaning they aim to increase product value while reducing the environmental impact of operations. They're focusing on developing solutions for lightweight, small, and energy-efficient product designs, plus researching recyclable materials to extend the material life cycle.
Pledges to improve energy efficiency and reduce greenhouse gas emissions, aligning with SBTi net-zero goals
The company has aligned its climate strategy with the Science-Based Targets initiative (SBTi) net-zero goals, a crucial signal to investors that their targets are scientifically credible. Their near-term targets, validated by SBTi, are clear: reduce Scope 1 and 2 emissions by 35% (compared to a 2016 baseline) and Scope 3 emissions by 15% (compared to a 2020 baseline) by the end of 2030. To achieve this, they are implementing five strategic action plans, including renewable energy procurement and low-carbon logistics. They already have 100% control over greenhouse gas (GHG) emissions across all global sites, adhering to the ISO 14064-1 standard. In 2024, 19 sites, covering 73% of their total facilities, obtained ISO 50001 certification for energy management.
Focus on water management, including wastewater recycling and monitoring, crucial for water-intensive chip production
Water scarcity is a major risk for the semiconductor industry, so ASEH's aggressive water management is a key resilience factor. The company uses a three-pronged strategy: reduce, reuse, and recycle. Total water withdrawals in 2024 amounted to 21.89 million tons, and their water use intensity per unit revenue was 7% higher than the previous year due to revenue decrease, but still represents a 43% decrease from the 2015 baseline. This is a metric to watch, as water-per-revenue is a better indicator of efficiency than absolute consumption. Their wastewater recycling systems are highly advanced in key production hubs.
Here's a quick look at the wastewater recycling rates in major facilities:
| Facility | Wastewater Reclamation Recycling Rate | Daily Processing Capacity (Kaohsiung/Chungli) |
| ASE Kaohsiung | 76% | Up to 30,000 tons per day (Kaohsiung) |
| ASE Chungli | 70% | Nearly 7,000 tons per day (Chungli) |
| ASE Malaysia | 50% | N/A |
| ASE Singapore | 25% | N/A |
The Kaohsiung facility's plant alone can recover 22,500 tons of water daily, which is a massive operational buffer. They are also expanding the implementation of the ISO 46001 Water Efficiency Management System, with five manufacturing sites already certified as of 2024.
Implementing internal carbon pricing to boost carbon reduction efforts across subsidiaries
To internalize the cost of GHG emissions and drive low-carbon investment, ASEH has fully integrated an internal carbon pricing mechanism across 100% of all manufacturing facilities. This is a clear, actionable financial tool. The implicit price is set at USD43 per tCO₂e of emissions, which is used in financial planning and to evaluate carbon reduction projects.
Here's the quick math: if a project saves 10,000 tCO₂e annually, the internal financial benefit is $430,000. This makes low-carbon initiatives more competitive against traditional capital expenditure. The system is implemented across the three major subsidiary groups:
- Advanced Semiconductor Engineering, Inc. (ASE)
- Siliconware Precision Industries Co., Ltd. (SPIL)
- USI Inc. (USI)
This widespread adoption strengthens climate risk adaptability and helps the company identify emerging low-carbon opportunities with high business potential.
Disclaimer
All information, articles, and product details provided on this website are for general informational and educational purposes only. We do not claim any ownership over, nor do we intend to infringe upon, any trademarks, copyrights, logos, brand names, or other intellectual property mentioned or depicted on this site. Such intellectual property remains the property of its respective owners, and any references here are made solely for identification or informational purposes, without implying any affiliation, endorsement, or partnership.
We make no representations or warranties, express or implied, regarding the accuracy, completeness, or suitability of any content or products presented. Nothing on this website should be construed as legal, tax, investment, financial, medical, or other professional advice. In addition, no part of this site—including articles or product references—constitutes a solicitation, recommendation, endorsement, advertisement, or offer to buy or sell any securities, franchises, or other financial instruments, particularly in jurisdictions where such activity would be unlawful.
All content is of a general nature and may not address the specific circumstances of any individual or entity. It is not a substitute for professional advice or services. Any actions you take based on the information provided here are strictly at your own risk. You accept full responsibility for any decisions or outcomes arising from your use of this website and agree to release us from any liability in connection with your use of, or reliance upon, the content or products found herein.