
|
Adani Total Gas Limited (ATGL.NS): Porter's 5 Forces Analysis |
Fully Editable: Tailor To Your Needs In Excel Or Sheets
Professional Design: Trusted, Industry-Standard Templates
Investor-Approved Valuation Models
MAC/PC Compatible, Fully Unlocked
No Expertise Is Needed; Easy To Follow
Adani Total Gas Limited (ATGL.NS) Bundle
In the dynamic landscape of the energy sector, Adani Total Gas Limited navigates a complex web of challenges and opportunities shaped by Porter’s Five Forces. From the bargaining power wielded by suppliers and customers to the competitive rivalry and the looming threats from substitutes and new entrants, each force plays a pivotal role in defining the strategic direction of this key player in the natural gas market. Delve deeper to uncover how these forces impact Adani Total Gas and what it means for investors and stakeholders alike.
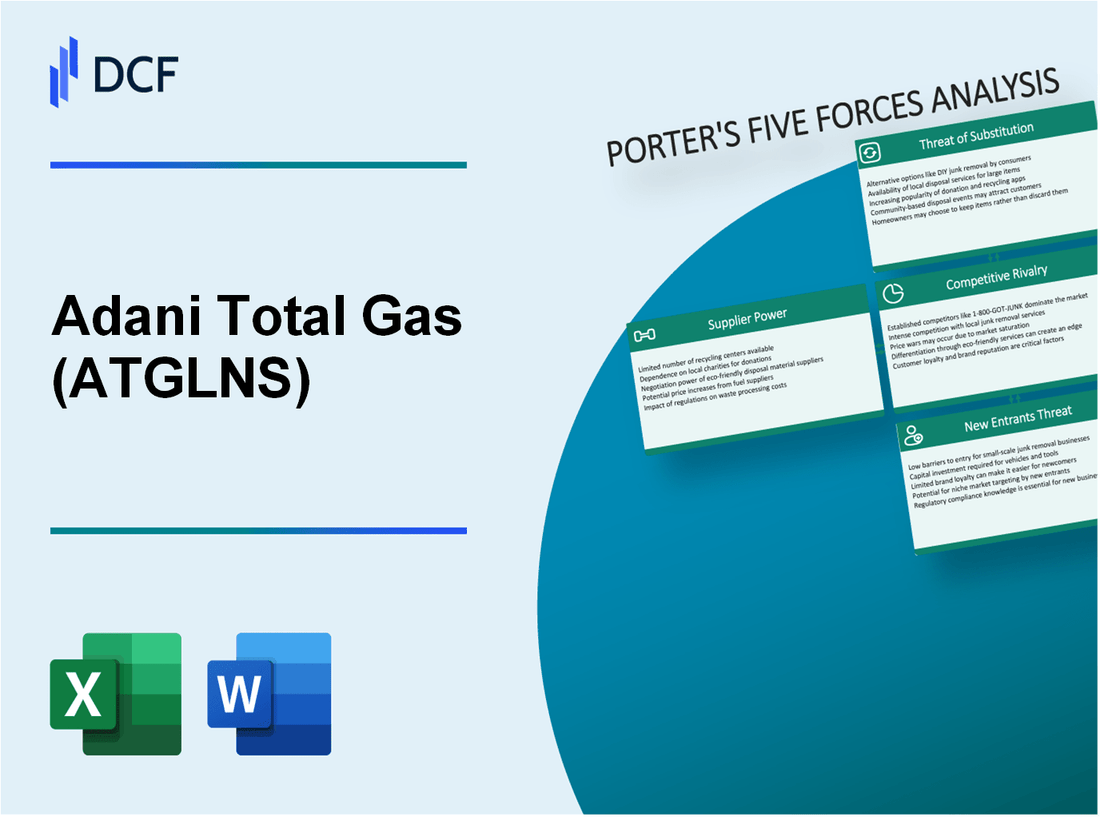
Adani Total Gas Limited - Porter's Five Forces: Bargaining power of suppliers
The bargaining power of suppliers for Adani Total Gas Limited is influenced by several critical factors.
Limited suppliers for natural gas resources
Adani Total Gas Limited operates in a market where the availability of natural gas suppliers is relatively limited. In India, around 80% of the country’s natural gas is sourced from domestic sources, including ONGC and Reliance Industries. This concentration can lead to increased supplier power, as few companies control the supply.
High dependency on technological equipment suppliers
The company relies on specialized technological equipment for gas distribution, and key suppliers wield significant influence. For instance, the gas infrastructure sector is dominated by major players such as GE and Siemens, which provide advanced technology solutions critical to operational efficiency. This reliance increases the vulnerability of Adani Total Gas Limited to price changes and supply interruptions from these vendors.
Strategic alliances with key suppliers reduce power
To mitigate supplier power, Adani Total Gas Limited has formed strategic alliances with key suppliers. For example, partnerships with international suppliers like TotalEnergies have helped diversify sourcing channels and enhance negotiation capabilities. Such collaborations can dilute the power that individual suppliers might otherwise have.
Long-term contracts stabilize supply chain
Adani Total Gas Limited often engages in long-term contracts with its suppliers, which help manage and stabilize pricing over time. These contracts typically span multiple years and include fixed pricing structures. As an example, in the fiscal year ending March 2023, approximately 60% of natural gas was procured under long-term agreements, minimizing the impact of market fluctuations on costs.
Price sensitivity due to energy market fluctuations
The energy market is highly volatile, significantly affecting supplier bargaining power. For instance, the price of natural gas in India has fluctuated between INR 2000 to INR 6500 per thousand cubic meters over the past year, correlated with international pricing shifts. Such volatility impacts the cost structure of Adani Total Gas Limited, creating a direct relationship between supplier power and market dynamics.
| Factor | Impact on Supplier Power | Statistics |
|---|---|---|
| Natural Gas Suppliers | High | 80% of natural gas sourced domestically |
| Technological Equipment Dependency | Medium | Major suppliers include GE, Siemens |
| Strategic Alliances | Low | Collaboration with TotalEnergies |
| Long-term Contracts | Low | 60% of gas procured under long-term agreements |
| Market Price Fluctuations | High | Gas prices fluctuated from INR 2000 to INR 6500 |
Overall, the bargaining power of suppliers for Adani Total Gas Limited is characterized by a unique blend of high dependency on specialized resources, limited supplier options, and strategic initiatives to balance power dynamics effectively.
Adani Total Gas Limited - Porter's Five Forces: Bargaining power of customers
The bargaining power of customers for Adani Total Gas Limited (ATGL) is influenced by several factors. Understanding these forces can provide insight into how customers interact with the company.
Limited switching costs for residential customers
Residential customers of Adani Total Gas face minimal switching costs when choosing alternative energy suppliers. In India, the penetration of piped natural gas (PNG) has been rapidly increasing, leading to more competitive options. According to the Ministry of Petroleum and Natural Gas, the number of PNG consumers has surged to over 1.5 million by the fiscal year 2022-23.
Industrial customers demand competitive pricing
Industrial customers represent a vital segment for ATGL, as they require competitive pricing structures. ATGL's pricing strategies are benchmarked against other suppliers. For instance, as of Q2 FY2023, ATGL's average gas tariff for industrial customers was around ₹32 per SCM, while competitors like Gujarat Gas offered pricing in a similar range. This competitive landscape gives industrial customers greater leverage in negotiations.
Growing customer awareness of sustainability
Customer awareness regarding sustainable energy practices has increased significantly. A survey conducted by the Energy and Resources Institute (TERI) highlighted that over 70% of Indian consumers prefer companies with sustainable practices. This trend pressures ATGL to maintain transparency and commitment to sustainability in its operations.
Alternatives like solar energy impact customer power
The rise of alternative energy sources, particularly solar energy, has begun affecting the bargaining power of customers in the natural gas sector. As of 2023, India’s solar capacity reached approximately 62 GW, providing a viable alternative for domestic and industrial consumers. This availability increases customers' power to negotiate better terms with gas suppliers.
Differentiation through customer service reduces power
ATGL has focused on enhancing customer service as a differentiating factor. The company reported a customer satisfaction rate of 82% in its last customer feedback survey. This high level of service reduces customer bargaining power, as satisfied customers are less likely to switch providers.
| Factor | Details |
|---|---|
| Residential Switching Costs | Minimal, with over 1.5 million PNG consumers as of FY2022-23 |
| Industrial Pricing | Average tariff around ₹32 per SCM, competitive pricing with Gujarat Gas |
| Sustainability Awareness | 70% of consumers prefer companies with sustainable practices |
| Solar Energy Capacity | Solar capacity at approximately 62 GW in India as of 2023 |
| Customer Satisfaction Rate | 82% as per last survey conducted |
These factors collectively highlight the dynamics of customer bargaining power in the context of Adani Total Gas Limited. Understanding these nuances is essential for the company's strategic positioning in the energy market.
Adani Total Gas Limited - Porter's Five Forces: Competitive rivalry
The competitive landscape for Adani Total Gas Limited is characterized by several robust factors that define the intensity of rivalry in the energy sector.
Presence of major players in energy sector
The energy sector in India hosts numerous major players, including Reliance Industries, Indraprastha Gas Limited (IGL), and Bharat Gas. As of FY 2023, IGL reported a market capitalization of approximately ₹21,000 crore, while Reliance Industries, with its diversified portfolio, dominated with a market cap around ₹15 lakh crore.
Competitive pricing strategies intensify rivalry
Competitive pricing strategies are prevalent among energy companies in India. As of 2023, Adani Total Gas offers natural gas at prices that range between ₹25 to ₹30 per SCM in urban areas. Rivals like IGL and MGL (Mahanagar Gas Limited) have similarly priced their offerings competitively, often leading to price wars to attract customers. The average price of natural gas in the Indian market has been influenced by the Henry Hub index which has seen fluctuations, affecting pricing strategies.
Innovation in delivery and service adds competition
Innovation plays a crucial role in the energy market, with companies investing heavily in enhancing service delivery. For instance, Adani Total Gas reported an increase in its network of CNG stations to 500 stations by 2023. Competitors like IGL and MGL have also expanded their networks, with IGL operating over 600 CNG stations as of the same year, driving further competition on service and accessibility.
Regulatory changes and compliance shape market dynamics
Regulatory frameworks significantly affect competitive rivalry. In 2023, the Indian government updated its policies regarding natural gas distribution, mandating an increase in city gas distribution networks by 30% over the next five years. Compliance with these regulations impacts operational costs, with companies anticipating an increase of up to 15% in compliance-related expenses in the near future.
Market share battles in regional and urban areas
Market share is fiercely contested, especially in urban centers. As of early 2023, Adani Total Gas held a market share of approximately 10% in the overall city gas distribution market. In contrast, IGL led with a share of around 24%, while MGL held approximately 18%. The following table outlines the market shares of key players in the city gas distribution market:
| Company | Market Share (%) | Market Capitalization (₹ Crore) |
|---|---|---|
| Indraprastha Gas Limited (IGL) | 24 | 21,000 |
| Mahanagar Gas Limited (MGL) | 18 | 9,500 |
| Adani Total Gas Limited | 10 | 1,50,000 |
| Reliance Industries Limited | 12 | 15,00,000 |
The intensity of competitive rivalry among these players continues to shape strategies and operational activities within the sector, emphasizing the need for differentiation and innovation to maintain market position.
Adani Total Gas Limited - Porter's Five Forces: Threat of substitutes
The threat of substitutes in the context of Adani Total Gas Limited is influenced by several emerging trends in the energy sector.
Rising adoption of renewable energy sources
In recent years, the adoption of renewable energy sources has surged, contributing to increased competition for traditional gas suppliers. According to the International Energy Agency (IEA), renewable energy capacity reached 3,000 GW globally in 2022, with a projected increase of 50% by 2025. This shift suggests a growing preference for alternatives to natural gas.
Technological advancements in electric solutions
Technological innovations have enabled the rise of electric solutions, eroding the market share of natural gas. For instance, the global electric vehicle (EV) market is expected to grow at a CAGR of 22%, reaching approximately 30 million units by 2030. This rise in EV adoption significantly reduces dependence on gas for transportation.
Decreasing costs of solar energy systems
The cost of solar energy systems has seen a rapid decline. From 2010 to 2021, the average global price for solar photovoltaic (PV) modules fell by 89%, according to the IEA. In 2023, the average cost of utility-scale solar installations is approximately $30 per megawatt-hour (MWh), making it an attractive substitute for consumers.
Government incentives for alternative energy adoption
Government policies have increasingly favored renewable energy sources. In India, for example, the government announced an extension of the Solar Park Scheme, aiming for a cumulative capacity of 100 GW by 2022. Furthermore, subsidy programs for electric vehicles and solar installations have been instrumental in driving adoption, creating competitive pressure on natural gas markets.
Customer shift towards more sustainable options
Consumer preferences are shifting dramatically towards sustainable energy solutions. A survey conducted by Deloitte in 2022 revealed that 73% of consumers are willing to change their buying habits to reduce environmental impact. This trend implies an increasing acceptance of alternatives such as solar, wind, and electric energy, posing a threat to the traditional gas market.
| Factor | Data |
|---|---|
| Global Renewable Energy Capacity (2022) | 3,000 GW |
| Projected Renewable Energy Increase (by 2025) | 50% |
| Global EV Market Size (by 2030) | 30 million units |
| Decline in Solar PV Module Prices (2010-2021) | 89% |
| Average Cost of Utility-scale Solar (2023) | $30/MWh |
| India’s Solar Capacity Target (2022) | 100 GW |
| Consumer Willingness to Shift for Sustainability (2022) | 73% |
These factors collectively indicate a significant threat of substitutes for Adani Total Gas Limited as the market landscape increasingly favors alternative energy sources.
Adani Total Gas Limited - Porter's Five Forces: Threat of new entrants
The threat of new entrants in the gas distribution sector, particularly for Adani Total Gas Limited (ATGL), is influenced by several key factors.
High capital investment required for infrastructure
Entering the gas distribution business necessitates substantial capital expenditure. ATGL has invested approximately ₹4,000 crore (around $500 million) in its infrastructure network as of 2022, covering over 11,000 kilometers of pipeline as per their public disclosures. The need for similar investments acts as a strong deterrent for new entrants.
Stringent regulatory and safety standards
The gas distribution sector is subject to rigorous regulatory scrutiny. The Petroleum and Natural Gas Regulatory Board (PNGRB) enforces strict compliance measures. New entrants must navigate lengthy licensing processes, which include demonstrating adherence to safety norms and environmental regulations, often taking over 12-18 months to secure necessary approvals.
Established brand and customer loyalty barriers
ATGL enjoys a strong brand presence, built through years of reliable service. In the fiscal year ending March 2023, ATGL reported a customer base of over 3.1 million connections. The loyalty fostered by existing customer relationships makes it challenging for newcomers to penetrate the market, as customer acquisition costs escalate in a competitive landscape.
Economies of scale necessary to compete effectively
ATGL has achieved significant economies of scale, which enable it to deliver competitive pricing and margins. For the financial year 2022, the company reported a total revenue of approximately ₹8,300 crore (around $1.04 billion), with an operating profit margin of 15%. New entrants lacking such scale would struggle to match these efficiencies.
Geographic and market experience crucial for entry
Market experience plays a pivotal role in the gas distribution business. ATGL has developed expertise in navigating local markets, customer preferences, and operational challenges across its service areas. With over 30 geographical areas under its coverage, the intricate understanding of regional dynamics is a barrier for new entrants aiming to identify lucrative markets.
| Factor | Details | Impact on New Entrants |
|---|---|---|
| Capital Investment | ₹4,000 crore investment in infrastructure | High financial barrier |
| Regulatory Standards | Approval process of 12-18 months | Lengthy entry process |
| Customer Base | 3.1 million connections as of March 2023 | Strong customer loyalty |
| Revenue & Profits | ₹8,300 crore in revenue, 15% operating margin | Economies of scale advantage |
| Geographical Reach | 30+ geographical areas covered | Significant market experience |
Overall, the combination of substantial capital requirements, regulatory hurdles, established customer loyalty, economies of scale, and local market expertise creates a formidable barrier that significantly reduces the threat of new entrants in the gas distribution segment where Adani Total Gas Limited operates.
Adani Total Gas Limited operates in a complex landscape shaped by Porter's Five Forces, where fluctuating supplier power, evolving customer preferences, intense competitive rivalry, the threat of substitutes, and formidable barriers to new entrants all come into play. Understanding these dynamics is essential for navigating the energy sector's challenges while capitalizing on emerging opportunities for growth and sustainability.
[right_small]Disclaimer
All information, articles, and product details provided on this website are for general informational and educational purposes only. We do not claim any ownership over, nor do we intend to infringe upon, any trademarks, copyrights, logos, brand names, or other intellectual property mentioned or depicted on this site. Such intellectual property remains the property of its respective owners, and any references here are made solely for identification or informational purposes, without implying any affiliation, endorsement, or partnership.
We make no representations or warranties, express or implied, regarding the accuracy, completeness, or suitability of any content or products presented. Nothing on this website should be construed as legal, tax, investment, financial, medical, or other professional advice. In addition, no part of this site—including articles or product references—constitutes a solicitation, recommendation, endorsement, advertisement, or offer to buy or sell any securities, franchises, or other financial instruments, particularly in jurisdictions where such activity would be unlawful.
All content is of a general nature and may not address the specific circumstances of any individual or entity. It is not a substitute for professional advice or services. Any actions you take based on the information provided here are strictly at your own risk. You accept full responsibility for any decisions or outcomes arising from your use of this website and agree to release us from any liability in connection with your use of, or reliance upon, the content or products found herein.