
|
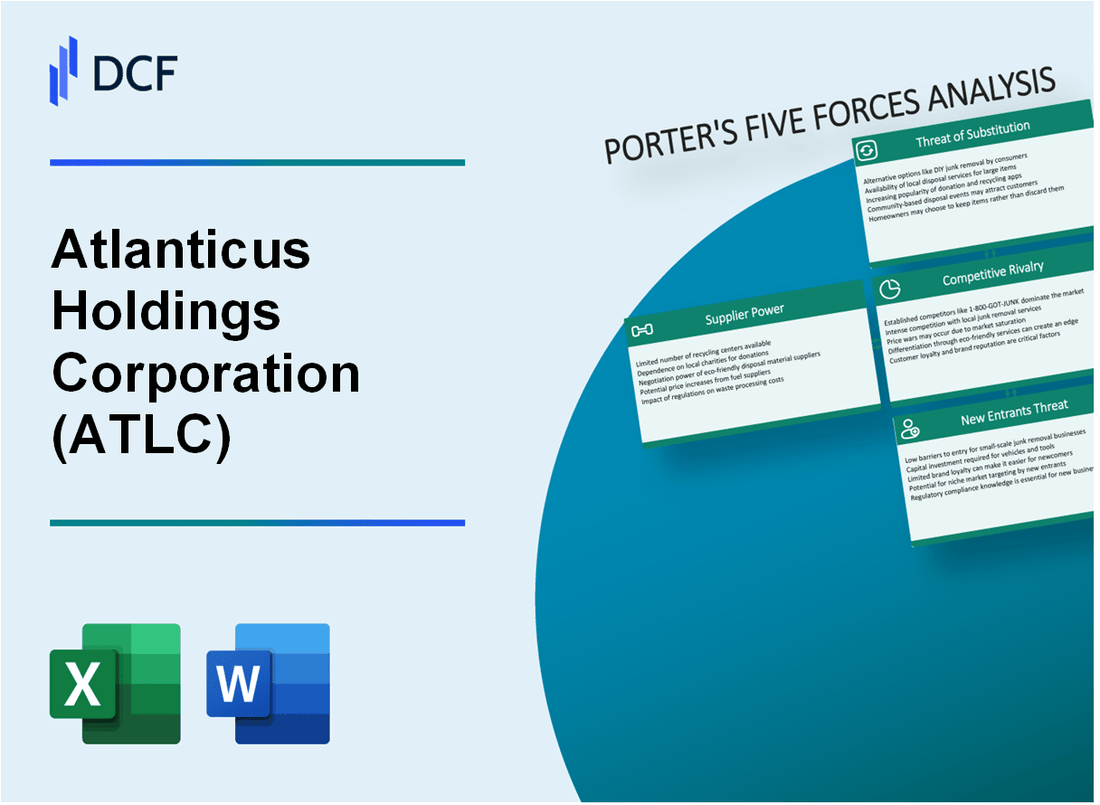
Atlanticus Holdings Corporation (ATLC): 5 FORCES Analysis [Nov-2025 Updated] |
Fully Editable: Tailor To Your Needs In Excel Or Sheets
Professional Design: Trusted, Industry-Standard Templates
Investor-Approved Valuation Models
MAC/PC Compatible, Fully Unlocked
No Expertise Is Needed; Easy To Follow
Atlanticus Holdings Corporation (ATLC) Bundle
You're looking for a clear-eyed view of Atlanticus Holdings Corporation (ATLC) and its position in the competitive, near-prime credit market as of late 2025. Honestly, the numbers show a company navigating a tight spot: while managed receivables hit $3.0 billion and they posted a strong 20.8% Return on Equity in Q2 2025, funding costs are biting hard, with interest expense jumping 41.5% to $53.7 million. This environment-where bank partners hold regulatory cards and rivals like Enova International are aggressively chasing the same customers after the Mercury acquisition added $3.2 billion in receivables-demands a sharp look at the competitive landscape. Below, we break down the five forces, from the rising power of capital providers who forced $894.7 million in new borrowings to the threat of Buy Now Pay Later services, so you can see exactly where the pressure points are for Atlanticus Holdings Corporation.
Atlanticus Holdings Corporation (ATLC) - Porter's Five Forces: Bargaining power of suppliers
When you look at Atlanticus Holdings Corporation (ATLC), the power held by its suppliers is definitely a critical factor, especially when it comes to money and the infrastructure that lets them lend. Honestly, the cost of money is a major lever here, and right now, that lever is being pulled up.
The pressure from capital providers is clear in the recent numbers. For the second quarter of 2025, Atlanticus Holdings Corporation's interest expense jumped a significant 41.5% compared to the prior year period, hitting $53.7 million. This rise directly reflects both the increased debt load needed for growth and the higher cost of that new capital. To keep pace with expanding receivables, the company has been forced to tap the capital markets aggressively. The outline suggests $894.7 million in new borrowings occurred in Q2 2025, which aligns with the overall trend of rising debt to finance growth.
Here's a quick look at how the debt stack has grown, showing the need to secure funding from these powerful providers:
| Metric | As of June 30, 2025 | As of June 30, 2024 |
|---|---|---|
| Outstanding Notes Payable, Net | $2,431.0 million | $1,816.8 million |
| Q2 2025 Interest Expense | $53.7 million | $37.9 million |
The reliance on capital markets means that providers of that capital have substantial leverage. Furthermore, the structure of the business means Atlanticus Holdings Corporation must issue new senior notes, like the 9.25% Senior Notes due 2029, to secure the necessary scale. This need to constantly issue new debt to fund growth gives the buyers of those notes considerable power over terms and pricing.
The regulatory structure also concentrates power in specific supplier relationships. Atlanticus Holdings Corporation relies on bank partners, such as The Bank of Missouri and WebBank, to hold the actual lending charter. This arrangement is key because the banks carry the regulatory burden, giving them high regulatory leverage over the fintech operations of Atlanticus Holdings Corporation. If these bank partners become restrictive or change terms, it directly impacts the company's ability to originate loans.
On the technology side, the power dynamic shifts in Atlanticus Holdings Corporation's favor. The company has invested heavily in its own infrastructure, which lessens the grip of external tech vendors. You can see this strength in the core of their Credit as a Service (CaaS) segment.
- Proprietary analytics drive instant decisioning.
- Long-standing CaaS platform is a core asset.
- Technology and data suppliers generally hold low power.
However, when it comes to the payment rails for its general-purpose cards, the power shifts back to the major networks. Credit card networks like Visa and Mastercard are essential suppliers for any general-purpose card program. They are effectively non-substitutable for broad consumer acceptance, meaning Atlanticus Holdings Corporation has little choice but to adhere to their interchange fees and operating rules. This is a classic example of high supplier power due to a lack of viable alternatives for that specific function.
Finance: draft 13-week cash view by Friday
Atlanticus Holdings Corporation (ATLC) - Porter's Five Forces: Bargaining power of customers
You're analyzing the customer side of Atlanticus Holdings Corporation's business, and honestly, the power dynamic here is a fascinating tug-of-war between necessity and choice. For Atlanticus Holdings Corporation, the bargaining power of its customers is generally kept in check by the very nature of the credit market it serves, but macroeconomic shifts can definitely tip the scales.
Customers served by Atlanticus Holdings Corporation are predominantly in the near-prime/subprime credit segments. This is a segment with historically fewer options from traditional banks, which inherently lowers the individual customer's bargaining power when seeking credit access. We see this demand clearly; for instance, in early 2025, 12% of subprime consumers reported interest in obtaining a new credit card, far higher than the 3.2% interest shown by super-prime borrowers. This high demand for access suggests customers are less likely to walk away over minor pricing differences, provided the terms are within acceptable market ranges for their profile.
Once a customer establishes a relationship and begins using a specific card product from Atlanticus Holdings Corporation's partners, switching costs can become a factor. While explicit data on contractual switching fees is proprietary, the implicit cost involves rebuilding credit history with a new issuer. For this customer base, credit utilization and payment history are paramount to improving their standing; moving to a new product means restarting the clock on demonstrating reliable behavior with that specific line of credit. Still, the market is dynamic, and subprime borrowers are actively looking for better terms, with unsecured personal loan originations for subprime borrowers up 35% year-over-year in Q2 2025.
The sheer scale of the customer base Atlanticus Holdings Corporation manages works to dilute individual customer influence. The company served 4.0 million accounts as of Q2 2025. Following the acquisition of Mercury Financial LLC, which added 1.3 million accounts, the total serviced accounts reached over 5 million, with the latest reported figure reaching over 5.7 million accounts served in Q3 2025. This massive base means no single customer or small group holds significant leverage over Atlanticus Holdings Corporation's overall strategy.
However, customer power definitely increases when the broader economy weakens, directly impacting Atlanticus Holdings Corporation's primary risk metric: credit quality. As the economy faces headwinds, like the concerns noted around a 'K-shaped economy' where lower-end consumers struggle, the risk of default rises. While credit card charge-offs saw a quarterly decline to 4.04% in Q2 2025, this figure remains 'very elevated compared to the past decade', indicating underlying stress. If charge-off rates spike due to economic pressure, customers gain leverage as lenders tighten standards or become more desperate to retain performing accounts.
To put the scale and risk into perspective, here is a snapshot of the customer base growth and related credit performance indicators:
| Metric | Value / Period | Context |
|---|---|---|
| Accounts Served (Pre-Acquisition Baseline) | 4.0 million | Q2 2025 |
| Accounts Added (Mercury Acquisition) | 1.3 million | Added via Mercury acquisition |
| Total Accounts Served (Latest Reported) | Over 5.7 million | Q3 2025 |
| Credit Card Charge-Off Rate | 4.04% | Q2 2025 |
| Subprime Personal Loan Origination Growth (YoY) | 35% increase | Q2 2025 |
The availability of competing fintech options, often integrating services directly into retail or online platforms (embedded finance), keeps price sensitivity high for this segment. While Atlanticus Holdings Corporation focuses on the underserved, these competitors are also targeting this space, forcing Atlanticus Holdings Corporation to maintain competitive pricing and product features. You can see this price sensitivity reflected in the regulatory discussions around interest rate caps, where 36% is a de facto ceiling for many subprime cards.
The key takeaways on customer power are:
- Customers are near-prime/subprime, meaning fewer alternatives exist.
- The total base is large-5.7 million accounts served as of Q3 2025.
- Economic weakness directly translates to higher credit risk for Atlanticus Holdings Corporation.
- Active search for new credit by subprime borrowers shows choice is present.
- Switching costs are primarily tied to rebuilding credit history, not high fees.
Finance: model the impact of a 100 basis point increase in charge-offs on Q4 2025 net income by Friday.
Atlanticus Holdings Corporation (ATLC) - Porter's Five Forces: Competitive rivalry
Competition within the segment Atlanticus Holdings Corporation serves is defintely intense, fueled by an environment characterized by an 'irrational competitive environment' and a steady stream of new fintech entrants looking to capture market share in the underserved credit space. This rivalry is not just about volume; it is a battle for scale and efficient deployment of capital in a market where every basis point matters.
Key rivals are actively pursuing the same non-prime customer base. We see direct competition from established players like Enova International (ENVA), Bread Financial (BFH), and OppFi (OPFI). To give you a sense of their momentum, Enova International reported that its overall second-quarter 2025 loan originations were up 28% year-on-year, reaching $1.8 billion, with total loan and finance receivables hitting a record $4.3 billion. This signals that the entire segment is growing, but the fight for customers is heating up.
Growth is the primary metric signaling aggressive market share focus for Atlanticus Holdings Corporation. As per the Q2 2025 results, Atlanticus's total managed receivables grew 26.1% to $3.0 billion. This internal growth trajectory was immediately overshadowed by a major strategic move to leapfrog competitors in scale. The subsequent acquisition of Mercury Financial added $3.2 billion in receivables, rapidly increasing Atlanticus Holdings Corporation's scale and, consequently, the intensity of the rivalry. Post-acquisition, Q3 2025 managed receivables reached $6.6 billion.
Here's a quick look at the scale shift driven by the acquisition:
| Metric | Atlanticus Holdings Corporation (Pre-Mercury, Q2 2025) | Mercury Financial Addition | Atlanticus Holdings Corporation (Post-Mercury, Q3 2025) |
|---|---|---|---|
| Managed Receivables | $3.0 billion | $3.2 billion | $6.6 billion |
| Accounts Served (Approximate Total) | 4.0 million | 1.3 million added | Over 5 million (as reported post-deal) |
The rivalry is inherently price-sensitive because the market is heavily driven by prevailing interest rates and the fees charged, especially when regulatory scrutiny is present. Financial sector firms, including fintechs, are known to be sensitive to interest rates and regulatory changes. While specific US regulatory caps directly impacting all key rivals were not universally detailed in recent reports, the pressure to optimize pricing is constant. The use of advanced data and technology, which Atlanticus Holdings Corporation and competitors like Mercury Financial employ, allows for better differentiation between non-prime borrowers, leading to more precise, and thus competitive, pricing for creditworthy customers within that segment.
This competitive dynamic forces Atlanticus Holdings Corporation to focus on operational efficiency and scale to maintain margins. The competitive pressures manifest in several ways:
- Aggressive customer acquisition spending.
- Focus on portfolio optimization post-merger.
- Need to leverage scale to absorb fixed costs.
- Constant monitoring of competitor pricing models.
The move to acquire Mercury Financial was a direct action to increase scale, which is a necessary defense in this highly competitive, price-sensitive environment.
Atlanticus Holdings Corporation (ATLC) - Porter's Five Forces: Threat of substitutes
You're analyzing the competitive landscape for Atlanticus Holdings Corporation, and the threat of substitutes is definitely a key area to watch, especially given the evolving consumer finance ecosystem. We need to look at alternatives that can satisfy the same customer need-access to credit-without using Atlanticus Holdings Corporation's primary offerings like private label credit or general purpose cards.
Buy Now Pay Later (BNPL) services are a growing substitute for point-of-sale private label credit, especially for smaller purchases. The global BNPL market is projected to reach $560.1 billion in Gross Merchandise Volume (GMV) in 2025, reflecting a 13.7% year-over-year increase. What's particularly relevant to Atlanticus Holdings Corporation's focus is that a significant portion of this market targets similar credit profiles; from 2021 to 2022, borrowers with deep subprime credit scores accounted for 45% of BNPL originations. Still, the adoption rate shows growth, with 21.1% of consumers with a credit record using BNPL in 2022, up from 17.6% in 2021.
Traditional banks' re-entry into near-prime lending during economic expansions poses a major threat, though specific 2025 market share data for this segment is not immediately clear. We do know that the prime rate stood at 7.5 percent as of February 2025, which influences the competitiveness of near-prime offerings. Also, the broader unsecured personal loan market, which often competes with near-prime credit, saw originations increase 15% in the third quarter of 2024 versus the same period in 2023. Atlanticus Holdings Corporation, as of Q2 2025, was managing $3.0 billion in receivables, showing its scale in this space.
Peer-to-peer lending platforms and other non-bank installment loan providers offer direct, non-card alternatives. While specific P2P market share figures against Atlanticus Holdings Corporation's portfolio are proprietary, the overall United States Alternative Lending Market is projected to reach $62.78 billion by 2025. These platforms compete for consumers seeking installment credit outside of traditional bank or card products, which is a segment Atlanticus Holdings Corporation serves. The company, having serviced over $44 billion in consumer loans over more than 25 years, applies its analytics to support lenders across various product types.
The company's Auto Finance segment faces substitution from captive finance arms and local buy-here, pay-here dealers. Auto loan originations, in general, increased by 1.5% year-over-year in the third quarter of 2024, though this was nearly 15% below the third quarter of 2019 level. Atlanticus Holdings Corporation's Auto Finance subsidiary specifically serves automotive dealers and non-prime financial organizations, meaning direct competition from manufacturer-backed financing arms is a constant factor in that vertical.
The threat is moderate because Atlanticus Holdings Corporation focuses on customers who often cannot access these prime or low-cost substitutes. The company states it impacts a market comprising almost a third of the U.S. population-consumers living paycheck to paycheck with less than perfect credit and limited savings. While BNPL and prime banks target better-qualified segments, the sheer size of the financially underserved market that Atlanticus Holdings Corporation targets provides a necessary buffer against complete substitution. For context, Atlanticus Holdings Corporation reported a Return on Average Equity of 20.8% in Q2 2025, indicating strong performance despite these competitive pressures.
Here are some key statistics related to these substitute products:
- Global BNPL market projected GMV for 2025: $560.1 billion.
- Percentage of BNPL originations from deep subprime borrowers (2021-2022): 45%.
- Atlanticus Holdings Corporation total accounts served as of June 30, 2025: 4.0 million.
- U.S. Alternative Lending Market projected size for 2025: $62.78 billion.
- Q3 2025 Net Income for Atlanticus Holdings Corporation: $24.98 million.
We can summarize the competitive landscape for substitutes in the following table:
| Substitute Category | Relevant Market Metric | Latest Available Data Point |
|---|---|---|
| Buy Now Pay Later (BNPL) | Projected Global GMV | $560.1 billion (2025) |
| BNPL User Profile | Share of U.S. Borrowers in Subprime/Deep Subprime | 61% (Estimate) |
| Traditional/Prime Credit | U.S. Prime Rate | 7.5 percent (February 2025) |
| Alternative Lending (P2P/Installment) | U.S. Market Size Projection | $62.78 billion (2025) |
| Atlanticus Holdings Corporation Scale | Managed Receivables | $3.0 billion (Q2 2025) |
The key takeaway here is that while substitutes like BNPL are growing rapidly and capturing a portion of the lower-credit consumer, their product structure (often short-term, point-of-sale) doesn't perfectly replace the need for longer-term, general-purpose credit that Atlanticus Holdings Corporation facilitates for its core demographic. Finance: draft 13-week cash view by Friday.
Atlanticus Holdings Corporation (ATLC) - Porter's Five Forces: Threat of new entrants
You're assessing the barriers to entry for a competitor looking to take market share from Atlanticus Holdings Corporation. The hurdles here are substantial, built on capital intensity and regulatory navigation.
High capital requirements and the need for significant funding are a major barrier to entry in this space. Atlanticus Holdings Corporation, for instance, required substantial financing to fuel its growth in the second quarter of 2025, reporting $894.7 million in new borrowings to help fund its investing outflows of $520.4 million. Furthermore, the company actively sought to bolster its position by pricing a $400 million senior notes offering in August 2025. This constant, large-scale need for debt and equity capital immediately screens out smaller, less capitalized players.
Regulatory complexity creates a steep learning curve that new entrants must master. This includes navigating a patchwork of state-level usury laws applicable to interest rates, which can vary significantly. Atlanticus Holdings Corporation itself had to adjust operations following the April 2025 court decision that vacated the CFPB late-fee rule. To be fair, the regulatory landscape is always shifting; for example, a recent development in Colorado in November 2025 signaled that out-of-state banks partnering with fintechs must now adhere to the state's 25% interest rate limit, showcasing how state-level actions directly affect partnership models.
New entrants are certainly attracted by the profitability demonstrated by established players. Atlanticus Holdings Corporation posted a Return on Equity (ROE) of 20.8% for Q2 2025. For comparison, one analysis showed Atlanticus's ROE at 22.6% against an industry median of 14.6%. This high return signals potential profits, but only for those who can overcome the initial capital and compliance hurdles.
Atlanticus Holdings Corporation's established infrastructure acts as a strong, non-replicable barrier. They apply experience gained from servicing over 20 million customers and over $40 billion in consumer loans across more than 25 years of operating history. This deep operational history and existing network are hard to duplicate quickly.
Here's a quick look at the established infrastructure that raises the barrier:
| Metric | Atlanticus Holdings Corporation Data Point | Context |
|---|---|---|
| Customer Base Serviced (Historical) | Over 20 million | Demonstrates scale and operational history |
| Consumer Loans Serviced (Historical) | Over $40 billion | Indicates significant transaction volume experience |
| Operating History | Over 25 years | Shows resilience through economic cycles |
| Q2 2025 Managed Receivables | $3.0 billion | Current scale of the managed portfolio |
Still, the nature of financial technology means traditional barriers can erode over time. Fintech companies leveraging superior Artificial Intelligence (AI) could disrupt the underwriting model by developing more accurate risk assessment tools that bypass the need for decades of historical data or massive physical infrastructure. The increased utilization of AI and Big Data analytics is a key trend in 2025 Fintech, which necessitates improved compliance with Cybersecurity and Data Protection regulations for any new entrant.
The key deterrents for new entrants right now include:
- High upfront capital needs for lending and compliance.
- Navigating complex, multi-state usury laws.
- The need to secure bank partnerships for charter access.
- The established track record of Atlanticus Holdings Corporation.
- The cost of building proprietary, compliant credit analytics.
Finance: draft a sensitivity analysis on the impact of a 50-basis-point increase in the average cost of borrowing on Q3 2025 projected net income by Friday.
Disclaimer
All information, articles, and product details provided on this website are for general informational and educational purposes only. We do not claim any ownership over, nor do we intend to infringe upon, any trademarks, copyrights, logos, brand names, or other intellectual property mentioned or depicted on this site. Such intellectual property remains the property of its respective owners, and any references here are made solely for identification or informational purposes, without implying any affiliation, endorsement, or partnership.
We make no representations or warranties, express or implied, regarding the accuracy, completeness, or suitability of any content or products presented. Nothing on this website should be construed as legal, tax, investment, financial, medical, or other professional advice. In addition, no part of this site—including articles or product references—constitutes a solicitation, recommendation, endorsement, advertisement, or offer to buy or sell any securities, franchises, or other financial instruments, particularly in jurisdictions where such activity would be unlawful.
All content is of a general nature and may not address the specific circumstances of any individual or entity. It is not a substitute for professional advice or services. Any actions you take based on the information provided here are strictly at your own risk. You accept full responsibility for any decisions or outcomes arising from your use of this website and agree to release us from any liability in connection with your use of, or reliance upon, the content or products found herein.