
|
Aurora Innovation, Inc. (AUR): 5 FORCES Analysis [Nov-2025 Updated] |
Fully Editable: Tailor To Your Needs In Excel Or Sheets
Professional Design: Trusted, Industry-Standard Templates
Investor-Approved Valuation Models
MAC/PC Compatible, Fully Unlocked
No Expertise Is Needed; Easy To Follow
Aurora Innovation, Inc. (AUR) Bundle
You're looking for a clear-eyed view of Aurora Innovation's (AUR) market position, and honestly, the autonomous trucking sector is a high-stakes game. Here is the Five Forces breakdown, grounded in the latest 2025 data, so you can map the near-term risks and opportunities. We see suppliers like PACCAR holding serious sway, while customers demand perfection before fully committing, even though the Aurora Driver promises an estimated 816% weekly profit jump over conventional methods. Still, the capital burn is real-think Q1 2025 R&D at $182 million-as the company fights rivals like Waymo for operational scale while projecting a full-year 2025 net loss of -$0.48 per share. Dive into the forces below to see exactly where the leverage lies for Aurora Innovation, Inc. right now.
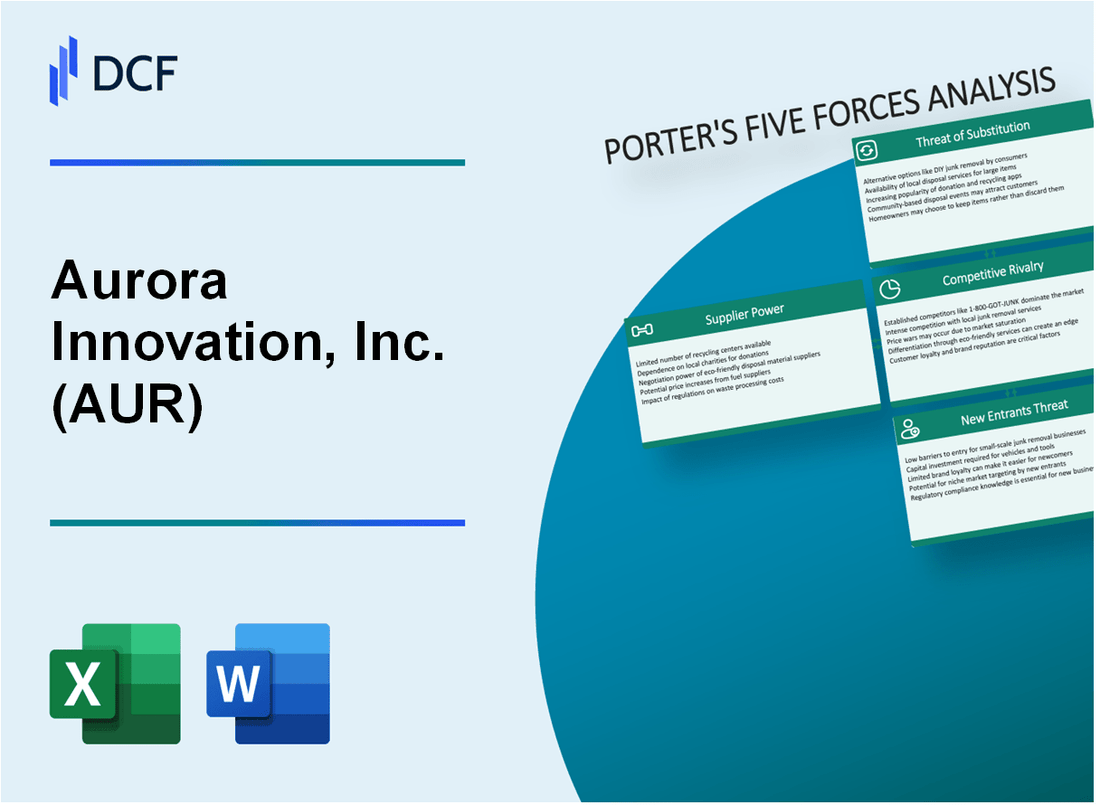
Aurora Innovation, Inc. (AUR) - Porter's Five Forces: Bargaining power of suppliers
You're looking at Aurora Innovation, Inc. (AUR) and the suppliers that feed its autonomous trucking ecosystem. Honestly, the power dynamic here is tilted toward the suppliers, especially the heavy-hitters who build the trucks and the core compute hardware.
Truck OEMs like PACCAR and Volvo hold significant leverage. They build the complex, purpose-built vehicles that Aurora Innovation, Inc. needs to integrate the Aurora Driver into. These aren't off-the-shelf components; they require deep, tailored integration. For instance, Aurora has production agreements with both PACCAR (for Kenworth and Peterbilt) and Volvo Group through Volvo Autonomous Solutions. The OEM relationship dictates the vehicle platform itself. To give you a concrete example of this control, shortly after Aurora Innovation, Inc. announced its first commercial driverless hauls between Dallas and Houston in May 2025, reports indicated a reversion to having safety operators behind the wheels on that route, following pressure from PACCAR. This shows the OEM has a say in the nature and timeline of the commercialization milestone, even if the autonomy system is doing the driving. Aurora Innovation, Inc. is targeting driverless operation without a partner requested observer by the second quarter of 2026.
Reliance on a few key Tier 1 suppliers for co-developed, scalable hardware concentrates power. Continental is central here, working with Aurora Innovation, Inc. to jointly develop reliable, serviceable, and cost-efficient autonomous hardware kits for mass production, which is slated for 2027. Continental is also developing the specialized independent secondary system, the fallback system, also planned for a 2027 production start. This deep co-development creates high switching costs; ripping out Continental's integrated hardware and safety systems would be a massive undertaking.
Specialized sensor and compute suppliers, like NVIDIA, also wield considerable power due to proprietary intellectual property (IP) and high integration costs. NVIDIA powers the primary computer of the Aurora Driver with a dual NVIDIA DRIVE Thor SoC configuration running DriveOS. Production samples of this advanced compute were expected in the first half of 2025. NVIDIA's automotive vertical business is projected to grow to approximately $5 billion in fiscal year 2026.
Aurora Innovation, Inc. recognizes this dynamic, which is why the shift to a second-generation hardware kit is a defintely necessary move. This next-generation kit is explicitly designed to address supplier cost leverage. Aurora Innovation, Inc. expects this second-generation hardware to drive a 50% plus reduction in their hardware costs. This cost reduction is a critical milestone on the path to self-funding. The company received B-samples for this new kit and expects the first complete prototype by the end of 2025. For context on the current cost structure, Aurora Innovation, Inc. reported a cost of revenue of $5 million in the second quarter of 2025.
Here's a quick look at the key supplier dependencies and timelines:
| Supplier/Partner Type | Key Entity/Component | Production/Milestone Target (as of 2025 reporting) | Financial/Cost Data Point |
|---|---|---|---|
| Truck OEM | PACCAR/Volvo | PACCAR built first prototypes of scalable platform. Driverless operation without observer targeted for Q2 2026. | Volvo Autonomous Solutions was a customer in Q2 2025 revenue recognition. |
| Tier 1 Hardware/Integration | Continental | Mass-manufacture of third-generation hardware kit and fallback system planned for 2027. | Expected to generate a 'high margin multi-billion dollar recurring revenue stream' from the hardware-as-a-service partnership. |
| Compute/IP Supplier | NVIDIA (DRIVE Thor SoC) | Production samples expected in first half of 2025. | NVIDIA's automotive vertical business expected to reach approx. $5 billion in FY2026. |
| Internal Cost Lever | Second-Generation Hardware Kit | First complete prototype expected by end of 2025. | Aims for a 50% plus reduction in hardware costs. |
The bargaining power of these suppliers is evident in the need for Aurora Innovation, Inc. to structure its entire scaling plan around their production schedules. This reliance is further underscored by the company's ongoing cash burn, with expected quarterly cash use for the remainder of 2025 projected to be between $175 million to $185 million on average.
The supplier landscape dictates several key operational realities for Aurora Innovation, Inc.:
- OEMs like PACCAR and Volvo dictate the base vehicle platform requirements.
- The initial driverless launch in May 2025 required a safety operator shortly after, suggesting OEM influence on operational rollout timing.
- Continental is responsible for the industrialization of the hardware, targeting a 2027 production start.
- NVIDIA's high-performance DRIVE Thor SoC is the core compute, locking in a key technology dependency.
- The second-generation hardware kit is a direct response to component cost pressures, aiming for a 50% plus reduction.
Finance: draft 13-week cash view by Friday.
Aurora Innovation, Inc. (AUR) - Porter's Five Forces: Bargaining power of customers
You're looking at Aurora Innovation, Inc. (AUR) right now, and the customer side of the equation is complex because they are still in the early commercialization phase. The power customers hold is directly related to the perceived risk and the current scale of deployment.
Large, sophisticated customers like FedEx, Werner Enterprises, and Uber Freight are demanding flawless, proven safety and performance before fully committing their high-volume freight to the Aurora Driver. To be fair, Aurora has built a strong foundation to counter this, having accumulated over 3.3 million commercial miles with nearly 100% on-time performance and zero collisions attributed to the Aurora Driver. As of late October 2025, the driverless-only operations surpassed 100,000 driverless miles on public roads.
The high potential value proposition is the key factor limiting customer power once the technology is scaled. For instance, one case study demonstrated a potential profit increase from $185 to $1,695 per week on a single route, which is an 816% improvement. That kind of margin expansion gives carriers a strong incentive to adopt, even with initial risks.
Still, the early-stage commercial deployment means customers face relatively low switching costs between Aurora Innovation, Inc. and its competitors, or even sticking with traditional methods for now. Aurora only began recognizing revenue from its Aurora Driver for Freight service in the three months ended June 30, 2025, reporting $1 million in revenue for Q2 2025. The company is still in the process of proving the model, with plans to deploy driverless trucks without a partner-requested observer in Q2 2026. If onboarding or integration takes longer than expected, customer leverage increases.
The customer base is currently concentrated, which naturally gives those few key partners more leverage. Aurora Innovation, Inc. is actively working with a defined set of industry leaders, but the driverless cohort is still small. Here's a snapshot of the key relationships as of late 2025:
| Customer/Partner Type | Specific Entities Mentioned | Status/Metric |
|---|---|---|
| Early Adopter/Key Partner | Hirschbach Motor Lines | Early adopter on Dallas-Houston and Fort Worth-El Paso lanes |
| New Driverless Cohort Member | Russell Transport | Executed agreement for driverless hauls on Fort Worth to El Paso lane |
| Major Logistics Partners | FedEx, Uber Freight, Werner Enterprises, Schneider | Working with Aurora across the ecosystem |
| Mid-Market Channel Partner | McLeod Software | Partnership to deliver seamless TMS integration for over 1,200 carriers |
Customers' ability to delay or limit adoption until regulatory clarity is achieved gives them significant leverage, especially since Aurora Innovation, Inc. is still operating its own fleet in the initial phase to develop the necessary playbooks. They are focused on scaling to hundreds of driverless trucks by the end of 2026.
The operational milestones that directly impact customer confidence include:
- Commercial driverless launch on the Dallas to Houston route in April 2025.
- Expansion to a second driverless lane, Fort Worth to El Paso, by October 2025.
- Validation of night driverless operations, effectively doubling potential utilization.
- Next-generation hardware expected to reduce overall cost by half.
Aurora Innovation, Inc. (AUR) - Porter's Five Forces: Competitive rivalry
You're looking at a market where the barriers to entry are sky-high due to the sheer capital required, and Aurora Innovation, Inc. is right in the thick of it. The rivalry is intense, not just from other trucking-focused players like Kodiak Robotics, but also from massive, well-funded entities focused on ride-hailing, like Waymo, which is aggressively expanding its operational design domain (ODD).
The capital intensity is clear in the financials. For the full-year 2025, the consensus analyst estimate for Aurora Innovation, Inc.'s net loss per share sits at ($0.49) per share. This follows a substantial $230 million loss from operations reported in Q2 2025 alone. Management has guided for quarterly cash use averaging between $175 million and $185 million for the remainder of 2025. Still, the company maintained $1.309 billion in cash and cash equivalents as of June 30, 2025, which improved to $1.6 billion by the time of the Q3 report, expected to fund operations into the second half of 2027.
Competition is definitely pivoting away from just who has the best white paper to who can actually scale operations and lock down commercial routes. Aurora Innovation, Inc. hit a major milestone by launching driverless commercial trucking operations in Q2 2025. This operational start immediately translated into revenue, with Q2 2025 revenue reported at $1 million. The technology is proving itself on the road; the Aurora Driver logged over 20,000 driverless miles through June 30, 2025, and the company has accumulated over 3.3 million total commercial miles with nearly 100% on-time performance.
Aurora's launch of driverless commercial operations in Q2 2025, starting on the lane between Dallas and Houston, gives them a critical first-mover advantage in the freight segment. They are already accelerating, validating driverless operations at night just three months after launch in July, which more than doubles potential truck utilization. By year-end 2025, they expect to unlock driverless operations in harsher weather conditions in the Sun Belt.
The competitive landscape has seen some early pioneers exit, but the remaining rivals are formidable, especially in the passenger space where Waymo is scaling rapidly. Here's a quick comparison of the operational scale as of mid-to-late 2025:
| Metric | Aurora Innovation (Trucking Focus) | Waymo (Ride-Hailing Focus) |
|---|---|---|
| Driverless Miles Logged (Through 6/30/25) | 20,000 miles | N/A (Focus on Rides) |
| Total Commercial Miles Logged | 3.3 million miles | N/A |
| Q2 2025 Revenue | $1 million | N/A |
| Weekly Ride Volume (Reported Early 2025) | N/A | Over 150,000 rides per week |
| City Expansion Plans (2025) | Expanding initial lanes (Dallas-Houston) | Plans to expand to 10 new cities in 2025 |
The shift in focus is visible in the operational metrics versus pure R&D spending. Aurora is now serving customers, which is the next phase of the race. The immediate competitive pressure points include:
- Securing OEM partnerships for hardware scale, with 20 new Volvo trucks expected by year-end 2025.
- Validating the Aurora Driver in night operations, effectively doubling utilization potential.
- Achieving gross profit in 2025 as part of the roadmap to scaling and self-funding in 2026.
- Competing against Waymo's aggressive expansion, which aims to be operational in 13 U.S. cities by the end of 2025.
- Managing the high R&D spend, which was $190 million in Q2 2025.
Aurora Innovation, Inc. (AUR) - Porter's Five Forces: Threat of substitutes
The primary substitute remains the traditional human-driven trucking model. This option is immediately available across all routes and carries a lower immediate regulatory risk profile compared to unproven autonomous systems.
Advanced Driver-Assistance Systems (ADAS) represent a partial substitute. These systems, which are less than Level 4 autonomy, appeal to risk-averse fleets by offering driver support without fully removing the human operator from the control loop. The market for these systems is established and requires less fundamental operational change than a full transition to the Aurora Driver.
High regulatory and public safety hurdles keep the human driver a persistent, viable substitute. While Aurora Innovation, Inc. has achieved significant safety milestones, such as logging over 100,000 driverless miles on public roads as of Q3 2025 and reporting zero Aurora Driver-attributed collisions across 3.3 million commercial miles, the technology is still in the early stages of broad deployment. The current operational scale is small; Aurora targeted tens of trucks for driverless operations by the end of 2025, which is a tiny fraction of the overall market.
The substitute's economic appeal is low when looking at the potential upside of the Aurora Driver. The economic case for adoption hinges on this significant profitability gap, which is the main driver to overcome the inertia of the substitute. Here's the quick math on the potential economic advantage based on a Phoenix to Fort Worth route analysis:
| Metric | Conventional Trucking (Substitute) | Aurora Driver (AUR) |
|---|---|---|
| Estimated Weekly Revenue | $6,150 | $16,400 |
| Estimated Weekly Profit | $185 | $1,695 |
| Profitability Improvement (Factor) | 1.0x | ~8.16x (816% increase) |
The substitute threat will decrease only as Aurora Innovation, Inc. expands its driverless fleet beyond the tens of trucks targeted for late 2025. The path to significantly eroding the substitute threat is tied directly to scaling the fleet size, with Aurora projecting to exit 2026 with hundreds of driverless trucks in operation.
Factors supporting the persistence of the human-driven substitute include:
- Immediate route availability across the entire network.
- Lower initial capital expenditure for fleets.
- Established insurance and liability frameworks.
- Current driverless fleet size is in the tens of units.
- Public and regulatory comfort levels are still developing.
Aurora Innovation, Inc. (AUR) - Porter's Five Forces: Threat of new entrants
You're looking at the barriers to entry in autonomous trucking, and honestly, the landscape for Aurora Innovation, Inc. is heavily fortified. The threat from brand-new players trying to replicate what they've built is extremely low, primarily due to the sheer financial muscle required just to keep the lights on while developing this tech.
The capital barrier to entry is extremely high; it's not a software startup you can bootstrap in a garage. Look at the investment required just to maintain the pace of innovation. Aurora's Q1 2025 R&D expenses were reported at $182 million. That kind of sustained, nine-figure quarterly spend immediately filters out anyone without deep pockets or a massive, committed funding runway. Defintely not a weekend project.
Next, you have the intellectual property and technical moat. Aurora Innovation, Inc. isn't just writing code; they are building the physical brain of the truck. This involves proprietary hardware like the FirstLight Lidar, which uses Frequency Modulated Continuous Wave (FMCW) technology to achieve long-range sensing and instant velocity data. Building this from scratch, or even acquiring the necessary expertise through acquisitions like Blackmore and OURS Technology, represents a massive, non-replicable IP barrier for a newcomer.
The regulatory and safety validation process is another wall that takes years and millions to scale. Establishing the 'safety case'-the comprehensive justification that the Aurora Driver is safer than a human-is a long, expensive, and non-replicable barrier. While Aurora announced a commercial launch in April 2025, they continue to navigate complex federal requirements, such as securing a key waiver in October 2025 to use cab-mounted warning beacons instead of traditional cones. This ongoing, high-stakes validation process is a significant deterrent.
To show you how well-capitalized Aurora Innovation, Inc. is against potential under-capitalized entrants, consider their balance sheet strength. Aurora's strong liquidity of $1.309 billion as of June 30, 2025, provides a substantial cushion. Here's the quick math: if their projected quarterly cash use for the remainder of 2025 is between $175 million and $185 million, that $1.309 billion gives them a runway that management expected to last into Q2 2027. A new entrant would need to match or exceed this war chest just to compete on development speed.
Finally, the commercialization pathway itself is gated by incumbent relationships. Entrants must secure major Original Equipment Manufacturer (OEM) partnerships, which are already largely locked up by current players like Aurora Innovation, Inc. The ecosystem is becoming an oligopoly of sorts, with Aurora already working with major players.
The established partnership landscape creates a significant hurdle for new entrants:
- Volvo Autonomous Solutions
- PACCAR
- Continental (hardware-as-a-service)
- Pilot customers including FedEx, Werner, and Schneider
- MOU signed with JB Hunt
The required investment across these three core areas-capital, IP, and partnerships-can be summarized by looking at the scale of their current operations:
| Metric | Value (Late 2025 Data) | Relevance to New Entrants |
|---|---|---|
| Q1 2025 R&D Spend | $182 million | Sets the minimum required investment to stay competitive in technology development. |
| Liquidity (as of June 30, 2025) | $1.309 billion | Deters smaller entrants by demonstrating a long, self-funded operational runway. |
| Proprietary Tech | FirstLight Lidar (FMCW) | Requires successful, multi-year development or expensive acquisition of similar IP. |
| Key OEM Partners | Volvo, PACCAR, Continental | Major truck manufacturers are already committed to the incumbent technology stack. |
New entrants face a steep climb against Aurora Innovation, Inc.'s established financial footing and deep integration into the heavy-duty trucking supply chain. Finance: draft 13-week cash view by Friday.
Disclaimer
All information, articles, and product details provided on this website are for general informational and educational purposes only. We do not claim any ownership over, nor do we intend to infringe upon, any trademarks, copyrights, logos, brand names, or other intellectual property mentioned or depicted on this site. Such intellectual property remains the property of its respective owners, and any references here are made solely for identification or informational purposes, without implying any affiliation, endorsement, or partnership.
We make no representations or warranties, express or implied, regarding the accuracy, completeness, or suitability of any content or products presented. Nothing on this website should be construed as legal, tax, investment, financial, medical, or other professional advice. In addition, no part of this site—including articles or product references—constitutes a solicitation, recommendation, endorsement, advertisement, or offer to buy or sell any securities, franchises, or other financial instruments, particularly in jurisdictions where such activity would be unlawful.
All content is of a general nature and may not address the specific circumstances of any individual or entity. It is not a substitute for professional advice or services. Any actions you take based on the information provided here are strictly at your own risk. You accept full responsibility for any decisions or outcomes arising from your use of this website and agree to release us from any liability in connection with your use of, or reliance upon, the content or products found herein.