
|
AvalonBay Communities, Inc. (AVB) DCF Valuation |
Fully Editable: Tailor To Your Needs In Excel Or Sheets
Professional Design: Trusted, Industry-Standard Templates
Investor-Approved Valuation Models
MAC/PC Compatible, Fully Unlocked
No Expertise Is Needed; Easy To Follow
AvalonBay Communities, Inc. (AVB) Bundle
Designed for accuracy, our (AVB) DCF Calculator empowers you to assess AvalonBay Communities, Inc. valuation using real-world financial data, while offering complete flexibility to modify all essential parameters for improved forecasting.
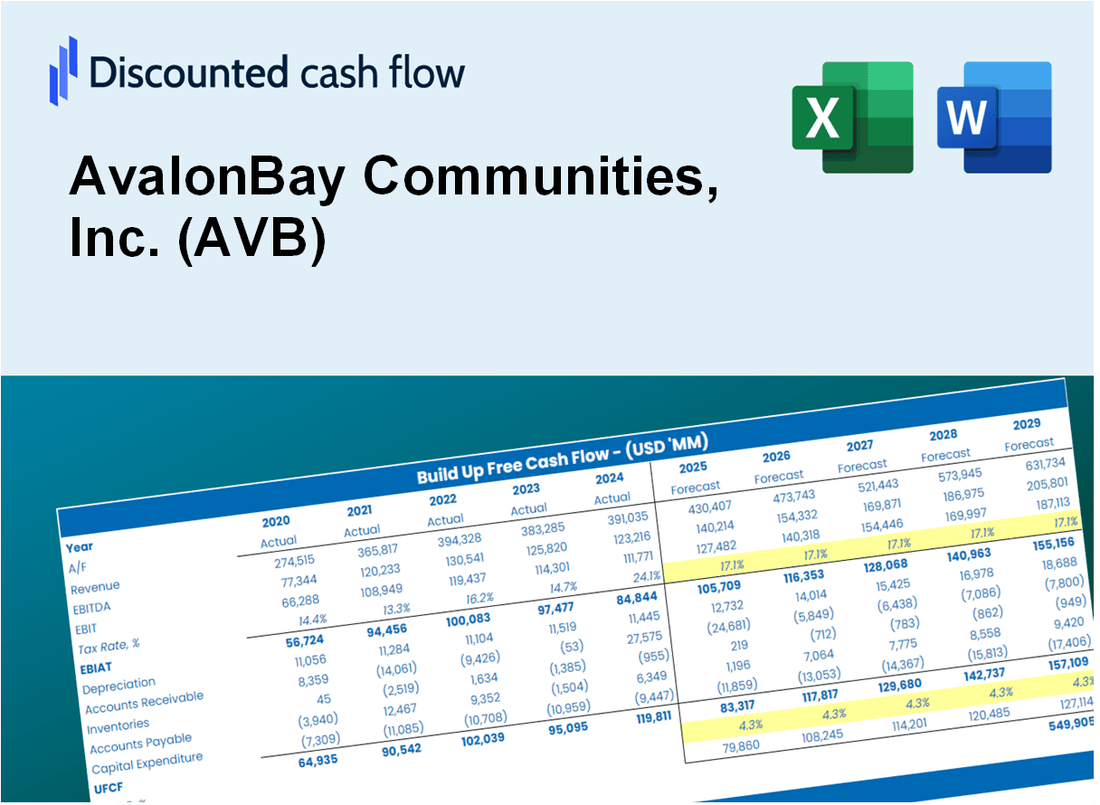
Discounted Cash Flow (DCF) - (USD MM)
| Year | AY1 2020 |
AY2 2021 |
AY3 2022 |
AY4 2023 |
AY5 2024 |
FY1 2025 |
FY2 2026 |
FY3 2027 |
FY4 2028 |
FY5 2029 |
|---|---|---|---|---|---|---|---|---|---|---|
| Revenue | 2,301.3 | 2,294.9 | 2,593.4 | 2,767.9 | 2,913.8 | 3,093.9 | 3,285.2 | 3,488.3 | 3,703.9 | 3,932.9 |
| Revenue Growth, % | 0 | -0.27859 | 13.01 | 6.73 | 5.27 | 6.18 | 6.18 | 6.18 | 6.18 | 6.18 |
| EBITDA | 1,745.9 | 1,989.1 | 2,196.1 | 1,961.5 | 2,156.1 | 2,426.2 | 2,576.2 | 2,735.4 | 2,904.5 | 3,084.1 |
| EBITDA, % | 75.87 | 86.68 | 84.68 | 70.87 | 74 | 78.42 | 78.42 | 78.42 | 78.42 | 78.42 |
| Depreciation | 707.3 | 758.6 | 815.0 | 817.0 | 846.9 | 951.7 | 1,010.5 | 1,073.0 | 1,139.3 | 1,209.7 |
| Depreciation, % | 30.74 | 33.06 | 31.42 | 29.52 | 29.06 | 30.76 | 30.76 | 30.76 | 30.76 | 30.76 |
| EBIT | 1,038.6 | 1,230.5 | 1,381.2 | 1,144.6 | 1,309.2 | 1,474.5 | 1,565.7 | 1,662.5 | 1,765.2 | 1,874.4 |
| EBIT, % | 45.13 | 53.62 | 53.26 | 41.35 | 44.93 | 47.66 | 47.66 | 47.66 | 47.66 | 47.66 |
| Total Cash | 217.0 | 420.3 | 613.2 | 397.9 | 108.6 | 430.0 | 456.6 | 484.8 | 514.7 | 546.6 |
| Total Cash, percent | .0 | .0 | .0 | .0 | .0 | .0 | .0 | .0 | .0 | .0 |
| Account Receivables | .0 | .0 | .0 | .0 | .0 | .0 | .0 | .0 | .0 | .0 |
| Account Receivables, % | 0 | 0 | 0 | 0 | 0 | 0 | 0 | 0 | 0 | 0 |
| Inventories | .0 | .0 | .0 | .0 | .0 | .0 | .0 | .0 | .0 | .0 |
| Inventories, % | 0 | 0 | 0 | 0 | 0 | 0 | 0 | 0 | 0 | 0 |
| Accounts Payable | 93.6 | 63.7 | 72.8 | 87.7 | 86.0 | 97.6 | 103.6 | 110.0 | 116.8 | 124.0 |
| Accounts Payable, % | 4.07 | 2.78 | 2.81 | 3.17 | 2.95 | 3.15 | 3.15 | 3.15 | 3.15 | 3.15 |
| Capital Expenditure | -137.0 | -153.2 | -174.7 | -197.3 | -198.0 | -206.0 | -218.7 | -232.3 | -246.6 | -261.9 |
| Capital Expenditure, % | -5.95 | -6.68 | -6.74 | -7.13 | -6.8 | -6.66 | -6.66 | -6.66 | -6.66 | -6.66 |
| Tax Rate, % | 0.05782269 | 0.05782269 | 0.05782269 | 0.05782269 | 0.05782269 | 0.05782269 | 0.05782269 | 0.05782269 | 0.05782269 | 0.05782269 |
| EBITAT | 1,042.6 | 1,223.5 | 1,364.0 | 1,132.7 | 1,308.5 | 1,465.9 | 1,556.5 | 1,652.8 | 1,754.9 | 1,863.4 |
| Depreciation | ||||||||||
| Changes in Account Receivables | ||||||||||
| Changes in Inventories | ||||||||||
| Changes in Accounts Payable | ||||||||||
| Capital Expenditure | ||||||||||
| UFCF | 1,706.5 | 1,798.9 | 2,013.3 | 1,767.3 | 1,955.5 | 2,223.2 | 2,354.3 | 2,499.9 | 2,654.4 | 2,818.5 |
| WACC, % | 6.4 | 6.4 | 6.39 | 6.39 | 6.4 | 6.4 | 6.4 | 6.4 | 6.4 | 6.4 |
| PV UFCF | ||||||||||
| SUM PV UFCF | 10,383.2 | |||||||||
| Long Term Growth Rate, % | 4.00 | |||||||||
| Free cash flow (T + 1) | 2,931 | |||||||||
| Terminal Value | 122,270 | |||||||||
| Present Terminal Value | 89,674 | |||||||||
| Enterprise Value | 100,057 | |||||||||
| Net Debt | 8,142 | |||||||||
| Equity Value | 91,915 | |||||||||
| Diluted Shares Outstanding, MM | 142 | |||||||||
| Equity Value Per Share | 645.20 |
What You Will Receive
- Comprehensive Financial Model: AvalonBay’s actual data facilitates accurate DCF valuation.
- Complete Forecast Control: Modify revenue growth, operating margins, WACC, and other essential metrics.
- Real-Time Calculations: Instantaneous updates allow you to view outcomes as adjustments are made.
- Professional-Grade Template: A polished Excel file crafted for high-quality valuation presentations.
- Flexible and Reusable: Designed for adaptability, enabling repeated use for in-depth forecasts.
Key Features
- 🔍 Real-Life AVB Financials: Pre-filled historical and projected data for AvalonBay Communities, Inc. (AVB).
- ✏️ Fully Customizable Inputs: Adjust all critical parameters (yellow cells) such as WACC, growth %, and tax rates.
- 📊 Professional DCF Valuation: Built-in formulas calculate AvalonBay’s intrinsic value using the Discounted Cash Flow method.
- ⚡ Instant Results: Visualize AvalonBay’s valuation instantly after making changes.
- Scenario Analysis: Test and compare outcomes for various financial assumptions side-by-side.
How It Works
- 1. Access the Template: Download and open the Excel file featuring AvalonBay Communities, Inc.'s (AVB) preloaded data.
- 2. Adjust Assumptions: Modify essential inputs such as growth rates, WACC, and capital expenditures.
- 3. Analyze Results Instantly: The DCF model automatically computes intrinsic value and NPV based on your inputs.
- 4. Explore Scenarios: Evaluate various forecasts to understand different valuation possibilities.
- 5. Present with Assurance: Deliver professional valuation analyses to back your investment decisions.
Why Choose This Calculator for AvalonBay Communities, Inc. (AVB)?
- All-in-One Solution: Combines DCF, WACC, and financial ratio analyses tailored for real estate investments.
- Flexible Inputs: Modify yellow-highlighted fields to explore different investment scenarios.
- In-Depth Analysis: Automatically computes AvalonBay’s intrinsic value and Net Present Value.
- Ready-to-Use Data: Historical and projected data provide reliable benchmarks for evaluation.
- High-Caliber Resource: Perfect for real estate analysts, investors, and financial advisors.
Who Should Use This Product?
- Real Estate Students: Understand property valuation techniques and apply them using real market data.
- Academics: Integrate professional real estate models into your coursework or research projects.
- Investors: Evaluate your own investment strategies and analyze valuation outcomes for AvalonBay Communities, Inc. (AVB).
- Analysts: Enhance your analysis process with a customizable DCF model tailored for real estate.
- Property Managers: Learn how large real estate companies like AvalonBay are assessed and valued in the market.
What the Template Contains
- Historical Data: Includes AvalonBay Communities, Inc.’s (AVB) past financials and baseline forecasts.
- DCF and Levered DCF Models: Detailed templates to calculate AvalonBay’s intrinsic value.
- WACC Sheet: Pre-built calculations for Weighted Average Cost of Capital.
- Editable Inputs: Modify key drivers like growth rates, EBITDA %, and CAPEX assumptions.
- Quarterly and Annual Statements: A complete breakdown of AvalonBay’s financials.
- Interactive Dashboard: Visualize valuation results and projections dynamically.
Disclaimer
All information, articles, and product details provided on this website are for general informational and educational purposes only. We do not claim any ownership over, nor do we intend to infringe upon, any trademarks, copyrights, logos, brand names, or other intellectual property mentioned or depicted on this site. Such intellectual property remains the property of its respective owners, and any references here are made solely for identification or informational purposes, without implying any affiliation, endorsement, or partnership.
We make no representations or warranties, express or implied, regarding the accuracy, completeness, or suitability of any content or products presented. Nothing on this website should be construed as legal, tax, investment, financial, medical, or other professional advice. In addition, no part of this site—including articles or product references—constitutes a solicitation, recommendation, endorsement, advertisement, or offer to buy or sell any securities, franchises, or other financial instruments, particularly in jurisdictions where such activity would be unlawful.
All content is of a general nature and may not address the specific circumstances of any individual or entity. It is not a substitute for professional advice or services. Any actions you take based on the information provided here are strictly at your own risk. You accept full responsibility for any decisions or outcomes arising from your use of this website and agree to release us from any liability in connection with your use of, or reliance upon, the content or products found herein.