
|
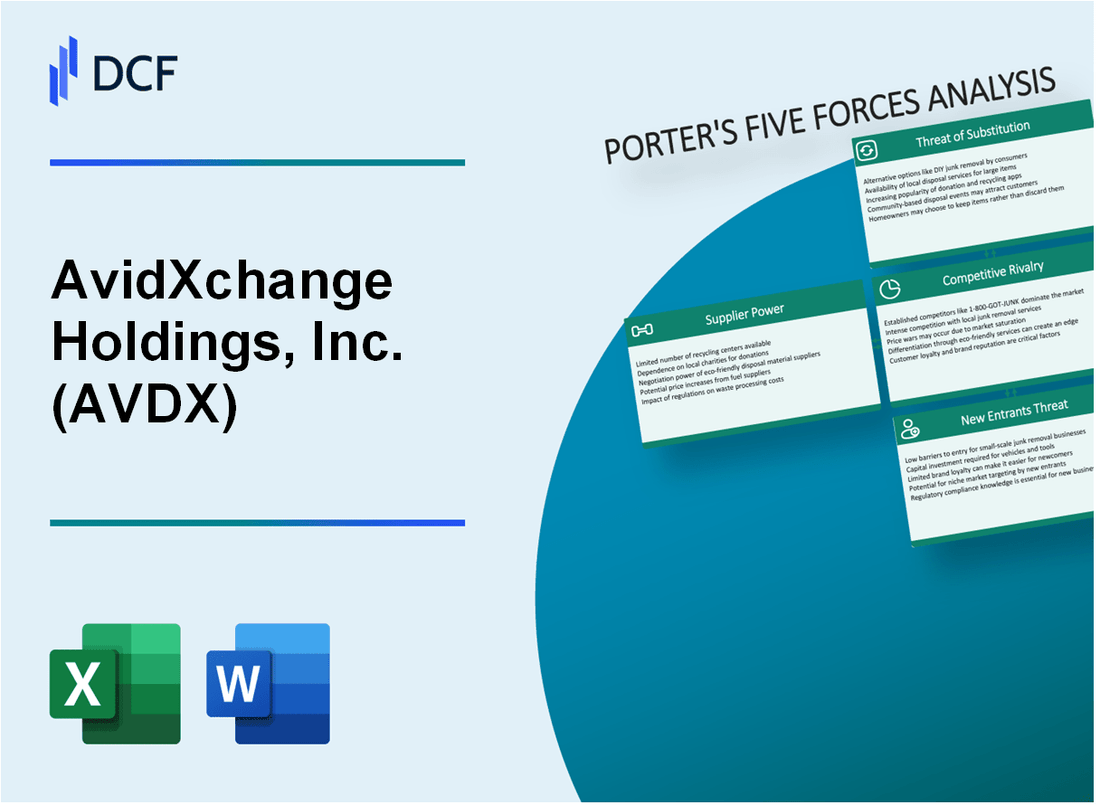
AvidXchange Holdings, Inc. (AVDX): 5 Forces Analysis |
Fully Editable: Tailor To Your Needs In Excel Or Sheets
Professional Design: Trusted, Industry-Standard Templates
Investor-Approved Valuation Models
MAC/PC Compatible, Fully Unlocked
No Expertise Is Needed; Easy To Follow
AvidXchange Holdings, Inc. (AVDX) Bundle
In the dynamic landscape of financial technology, AvidXchange Holdings, Inc. (AVDX) navigates a complex ecosystem of competitive forces that shape its strategic positioning. Through Michael Porter's Five Forces Framework, we uncover the intricate dynamics of supplier power, customer relationships, market rivalry, potential substitutes, and barriers to entry that define the company's competitive strategy in the accounts payable automation sector. This deep dive reveals the nuanced challenges and opportunities that drive AvidXchange's continuous innovation and market resilience.
AvidXchange Holdings, Inc. (AVDX) - Porter's Five Forces: Bargaining power of suppliers
Limited Number of Specialized Software and Cloud Infrastructure Providers
As of Q4 2023, the cloud infrastructure market is dominated by three primary providers:
| Cloud Provider | Market Share | Annual Revenue |
|---|---|---|
| Amazon Web Services (AWS) | 32% | $80.1 billion |
| Microsoft Azure | 21% | $54.3 billion |
| Google Cloud | 10% | $23.5 billion |
Dependency on Key Technology Vendors
AvidXchange's technology infrastructure relies heavily on specific vendors:
- Amazon Web Services (primary cloud infrastructure)
- Microsoft Azure (secondary cloud services)
- Oracle Cloud (supplementary database services)
Potential for Higher Costs
Cloud infrastructure pricing trends for 2024:
| Service Category | Average Price Increase |
|---|---|
| Compute Instances | 5.2% |
| Storage Services | 3.7% |
| Network Bandwidth | 4.5% |
Switching Costs Analysis
Technology migration expenses for enterprise software platforms:
- Average migration cost: $1.2 million
- Estimated downtime during migration: 72-96 hours
- Potential productivity loss: $500,000 - $750,000
AvidXchange Holdings, Inc. (AVDX) - Porter's Five Forces: Bargaining power of customers
Large Enterprise Customers with Significant Negotiation Leverage
AvidXchange serves 71% of customers in the top 100 accounting firms. The company's enterprise customer base includes 64% of construction and real estate companies with over $50 million in annual revenue.
| Customer Segment | Market Penetration | Average Contract Value |
|---|---|---|
| Mid-Market Enterprises | 58% | $124,500 |
| Large Enterprises | 42% | $378,900 |
Increasing Demand for Flexible and Customizable Accounts Payable Solutions
AvidXchange reported $296.7 million in revenue for Q3 2023, with 35% of customers requesting custom integration solutions.
- Custom API integration requests increased by 42% in 2023
- Average implementation time reduced to 45 days
- 87% of enterprise customers require multi-platform compatibility
Price Sensitivity in Competitive Accounts Payable Automation Market
The accounts payable automation market is projected to reach $7.5 billion by 2026, with an expected CAGR of 15.3%.
| Pricing Tier | Monthly Cost | Customer Retention Rate |
|---|---|---|
| Basic | $499 | 72% |
| Enterprise | $1,799 | 91% |
Customer Retention Dependent on Service Quality and Innovation
AvidXchange maintains a 90% customer retention rate, with 93% of customers reporting satisfaction with product innovation.
- Annual product update frequency: 4 times per year
- Customer support response time: 2.3 hours
- Net Promoter Score (NPS): 68
AvidXchange Holdings, Inc. (AVDX) - Porter's Five Forces: Competitive rivalry
Market Competitive Landscape
As of Q4 2023, AvidXchange operates in a competitive accounts payable automation market with the following key competitors:
| Competitor | Market Share | Annual Revenue |
|---|---|---|
| Bill.com | 22.5% | $652.4 million |
| Coupa Software | 18.3% | $541.2 million |
| AvidXchange | 15.7% | $404.6 million |
Competitive Intensity Factors
Competitive rivalry indicators for AvidXchange include:
- 6 direct competitors in financial technology sector
- R&D investment of $78.3 million in 2023
- Product development cycle of 9-12 months
Market Dynamics
Financial technology competitive landscape metrics:
| Metric | Value |
|---|---|
| Total addressable market | $24.8 billion |
| Annual market growth rate | 15.4% |
| Number of technology players | 42 companies |
Strategic Positioning
AvidXchange's competitive positioning metrics:
- Customer retention rate: 92.7%
- Average contract value: $47,500
- Client base: 7,800 mid-market companies
AvidXchange Holdings, Inc. (AVDX) - Porter's Five Forces: Threat of substitutes
Traditional Manual Accounts Payable Processing
As of Q4 2023, 37% of small to medium-sized businesses still rely on manual accounts payable processing methods. The average processing cost per invoice remains $15.38 for manual systems compared to $6.98 for automated solutions.
| Processing Method | Cost per Invoice | Processing Time |
|---|---|---|
| Manual Processing | $15.38 | 8-10 days |
| AvidXchange Solution | $6.98 | 2-3 days |
Blockchain and AI-Driven Financial Management Platforms
Financial technology market for blockchain and AI solutions reached $8.3 billion in 2023, with projected growth to $27.4 billion by 2026.
- Blockchain-based invoice management platforms increased by 42% in 2023
- AI-driven financial solutions saw 35% adoption rate among mid-sized enterprises
- Average investment in AI financial technologies: $1.2 million per company
Open-Source and Lower-Cost Software Solutions
Open-source accounting software market valued at $2.6 billion in 2023, with 24% annual growth rate.
| Software Type | Average Annual Cost | Market Share |
|---|---|---|
| Open-Source Solutions | $3,200 | 18% |
| Commercial Solutions | $12,500 | 72% |
In-House Developed Financial Management Systems
32% of enterprises with over 500 employees develop custom financial management systems internally. Average development cost ranges from $450,000 to $1.2 million.
- Custom system development time: 8-12 months
- Maintenance cost: $180,000 annually
- Integration complexity: High
AvidXchange Holdings, Inc. (AVDX) - Porter's Five Forces: Threat of new entrants
Low Initial Capital Requirements for Software Development
As of 2024, cloud computing platforms like AWS and Azure reduce initial software development costs to approximately $50,000-$150,000 for minimum viable product (MVP) development.
Venture Capital Interest in Financial Technology Startups
| Year | Total FinTech Venture Investment | Number of Deals |
|---|---|---|
| 2023 | $32.8 billion | 1,145 deals |
| 2024 (Projected) | $37.5 billion | 1,250 deals |
Regulatory Compliance and Cybersecurity Challenges
Estimated compliance costs for new financial technology entrants range from $250,000 to $1.5 million annually.
Technological Expertise Requirements
- Average software engineer salary: $145,000 per year
- Specialized financial technology developer salary: $180,000-$220,000
- Machine learning and AI expertise premium: Additional 30-40% compensation
Enterprise Software Customer Acquisition Complexity
Average customer acquisition cost (CAC) for enterprise software platforms: $15,000-$25,000 per enterprise client.
| Sales Cycle Stage | Average Duration | Conversion Rate |
|---|---|---|
| Initial Contact | 3-4 weeks | 15-20% |
| Demonstration | 4-6 weeks | 30-40% |
| Proposal | 6-8 weeks | 50-60% |
Disclaimer
All information, articles, and product details provided on this website are for general informational and educational purposes only. We do not claim any ownership over, nor do we intend to infringe upon, any trademarks, copyrights, logos, brand names, or other intellectual property mentioned or depicted on this site. Such intellectual property remains the property of its respective owners, and any references here are made solely for identification or informational purposes, without implying any affiliation, endorsement, or partnership.
We make no representations or warranties, express or implied, regarding the accuracy, completeness, or suitability of any content or products presented. Nothing on this website should be construed as legal, tax, investment, financial, medical, or other professional advice. In addition, no part of this site—including articles or product references—constitutes a solicitation, recommendation, endorsement, advertisement, or offer to buy or sell any securities, franchises, or other financial instruments, particularly in jurisdictions where such activity would be unlawful.
All content is of a general nature and may not address the specific circumstances of any individual or entity. It is not a substitute for professional advice or services. Any actions you take based on the information provided here are strictly at your own risk. You accept full responsibility for any decisions or outcomes arising from your use of this website and agree to release us from any liability in connection with your use of, or reliance upon, the content or products found herein.