
|
Broadcom Inc. (AVGO) DCF Valuation |
Fully Editable: Tailor To Your Needs In Excel Or Sheets
Professional Design: Trusted, Industry-Standard Templates
Investor-Approved Valuation Models
MAC/PC Compatible, Fully Unlocked
No Expertise Is Needed; Easy To Follow
Broadcom Inc. (AVGO) Bundle
Gain mastery over your Broadcom Inc. (AVGO) valuation analysis using our sophisticated DCF Calculator! Equipped with real AVGO data, this Excel template lets you adjust forecasts and assumptions to accurately determine Broadcom's intrinsic value.
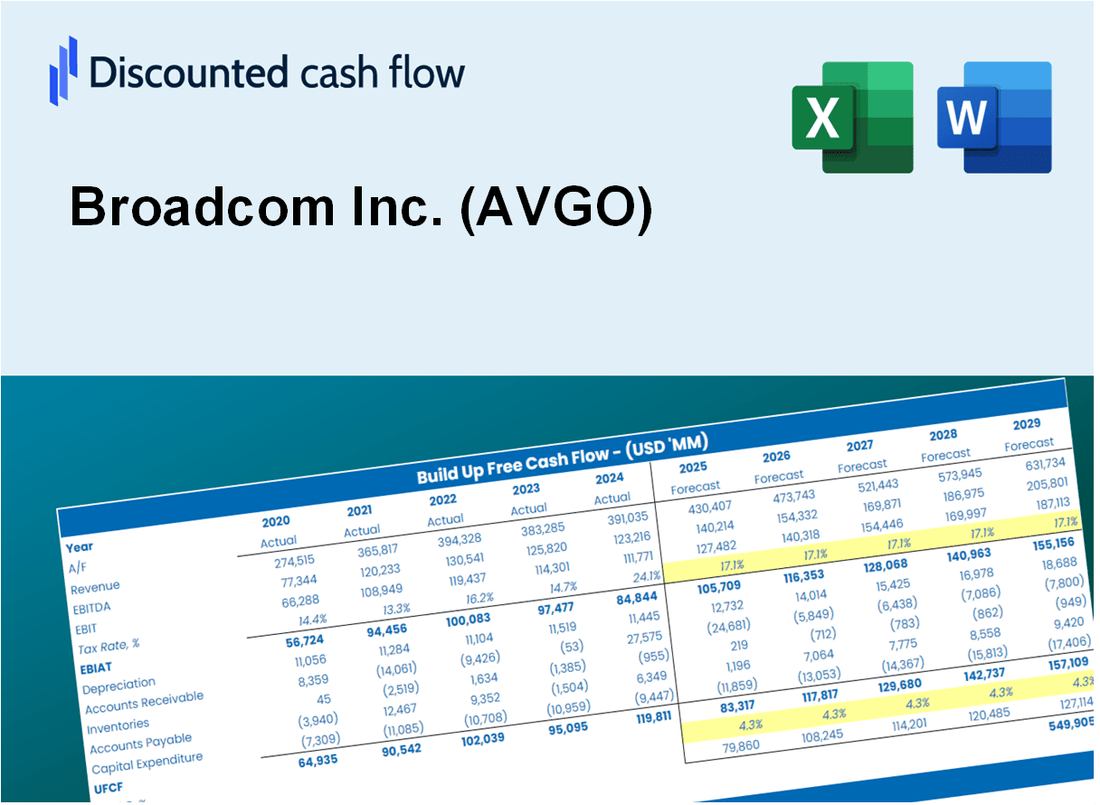
Discounted Cash Flow (DCF) - (USD MM)
| Year | AY1 2020 |
AY2 2021 |
AY3 2022 |
AY4 2023 |
AY5 2024 |
FY1 2025 |
FY2 2026 |
FY3 2027 |
FY4 2028 |
FY5 2029 |
|---|---|---|---|---|---|---|---|---|---|---|
| Revenue | 23,888.0 | 27,450.0 | 33,203.0 | 35,819.0 | 51,574.0 | 62,885.9 | 76,678.8 | 93,497.0 | 114,004.0 | 139,008.9 |
| Revenue Growth, % | 0 | 14.91 | 20.96 | 7.88 | 43.99 | 21.93 | 21.93 | 21.93 | 21.93 | 21.93 |
| EBITDA | 11,125.0 | 14,691.0 | 19,155.0 | 20,554.0 | 23,879.0 | 32,884.9 | 40,097.6 | 48,892.3 | 59,616.0 | 72,691.8 |
| EBITDA, % | 46.57 | 53.52 | 57.69 | 57.38 | 46.3 | 52.29 | 52.29 | 52.29 | 52.29 | 52.29 |
| Depreciation | 6,905.0 | 6,041.0 | 4,984.0 | 3,835.0 | 10,010.0 | 12,079.0 | 14,728.4 | 17,958.8 | 21,897.7 | 26,700.6 |
| Depreciation, % | 28.91 | 22.01 | 15.01 | 10.71 | 19.41 | 19.21 | 19.21 | 19.21 | 19.21 | 19.21 |
| EBIT | 4,220.0 | 8,650.0 | 14,171.0 | 16,719.0 | 13,869.0 | 20,805.8 | 25,369.2 | 30,933.5 | 37,718.3 | 45,991.2 |
| EBIT, % | 17.67 | 31.51 | 42.68 | 46.68 | 26.89 | 33.09 | 33.09 | 33.09 | 33.09 | 33.09 |
| Total Cash | 7,618.0 | 12,163.0 | 12,416.0 | 14,189.0 | 9,348.0 | 21,548.8 | 26,275.2 | 32,038.2 | 39,065.3 | 47,633.6 |
| Total Cash, percent | .0 | .0 | .0 | .0 | .0 | .0 | .0 | .0 | .0 | .0 |
| Account Receivables | 2,297.0 | 2,071.0 | 2,958.0 | 3,154.0 | 4,416.0 | 5,463.1 | 6,661.4 | 8,122.5 | 9,904.0 | 12,076.3 |
| Account Receivables, % | 9.62 | 7.54 | 8.91 | 8.81 | 8.56 | 8.69 | 8.69 | 8.69 | 8.69 | 8.69 |
| Inventories | 1,003.0 | 1,297.0 | 1,925.0 | 1,898.0 | 1,760.0 | 2,947.2 | 3,593.6 | 4,381.8 | 5,342.9 | 6,514.7 |
| Inventories, % | 4.2 | 4.72 | 5.8 | 5.3 | 3.41 | 4.69 | 4.69 | 4.69 | 4.69 | 4.69 |
| Accounts Payable | 836.0 | 1,086.0 | 998.0 | 1,210.0 | 1,662.0 | 2,146.0 | 2,616.6 | 3,190.6 | 3,890.4 | 4,743.6 |
| Accounts Payable, % | 3.5 | 3.96 | 3.01 | 3.38 | 3.22 | 3.41 | 3.41 | 3.41 | 3.41 | 3.41 |
| Capital Expenditure | -463.0 | -443.0 | -424.0 | -452.0 | -548.0 | -899.7 | -1,097.0 | -1,337.7 | -1,631.1 | -1,988.8 |
| Capital Expenditure, % | -1.94 | -1.61 | -1.28 | -1.26 | -1.06 | -1.43 | -1.43 | -1.43 | -1.43 | -1.43 |
| Tax Rate, % | 40.55 | 40.55 | 40.55 | 40.55 | 40.55 | 40.55 | 40.55 | 40.55 | 40.55 | 40.55 |
| EBITAT | 5,113.1 | 8,612.9 | 13,100.8 | 15,594.9 | 8,245.0 | 18,506.6 | 22,565.7 | 27,515.1 | 33,550.1 | 40,908.7 |
| Depreciation | ||||||||||
| Changes in Account Receivables | ||||||||||
| Changes in Inventories | ||||||||||
| Changes in Accounts Payable | ||||||||||
| Capital Expenditure | ||||||||||
| UFCF | 9,091.1 | 14,392.9 | 16,057.8 | 19,020.9 | 17,035.0 | 27,935.6 | 34,823.1 | 42,460.9 | 51,774.0 | 63,129.7 |
| WACC, % | 9.28 | 9.28 | 9.26 | 9.27 | 9.19 | 9.26 | 9.26 | 9.26 | 9.26 | 9.26 |
| PV UFCF | ||||||||||
| SUM PV UFCF | 164,182.7 | |||||||||
| Long Term Growth Rate, % | 4.00 | |||||||||
| Free cash flow (T + 1) | 65,655 | |||||||||
| Terminal Value | 1,248,972 | |||||||||
| Present Terminal Value | 802,254 | |||||||||
| Enterprise Value | 966,437 | |||||||||
| Net Debt | 58,218 | |||||||||
| Equity Value | 908,219 | |||||||||
| Diluted Shares Outstanding, MM | 4,778 | |||||||||
| Equity Value Per Share | 190.08 |
What You Will Receive
- Pre-Filled Financial Model: Broadcom’s actual data facilitates accurate DCF valuation.
- Comprehensive Forecast Control: Modify revenue growth, margins, WACC, and other essential factors.
- Real-Time Calculations: Automatic updates provide immediate results as you adjust inputs.
- Professional-Grade Template: A polished Excel file crafted for high-quality valuation.
- Flexible and Reusable: Designed for adaptability, allowing repeated use for in-depth forecasts.
Key Features
- Comprehensive AVGO Data: Pre-filled with Broadcom’s historical financials and future projections.
- Customizable Assumptions: Modify revenue growth rates, profit margins, WACC, tax rates, and capital expenditures.
- Interactive Valuation Model: Automatic recalculations of Net Present Value (NPV) and intrinsic value based on user inputs.
- Scenario Analysis: Develop multiple forecasting scenarios to explore various valuation possibilities.
- Intuitive Interface: Designed for ease of use, suitable for both professionals and newcomers.
How It Works
- Download the Template: Get immediate access to the Excel-based AVGO DCF Calculator.
- Input Your Assumptions: Modify the yellow-highlighted cells for growth rates, WACC, margins, and other variables.
- Instant Calculations: The model automatically recalculates Broadcom’s intrinsic value.
- Test Scenarios: Experiment with different assumptions to see how they affect the valuation.
- Analyze and Decide: Leverage the results to inform your investment or financial assessment.
Why Choose This Calculator for Broadcom Inc. (AVGO)?
- All-in-One Solution: Features DCF, WACC, and comprehensive financial ratio analyses seamlessly integrated.
- Flexible Inputs: Modify the yellow-highlighted fields to explore different financial scenarios.
- In-Depth Analysis: Automatically computes Broadcom’s intrinsic value and Net Present Value.
- Data-Rich Environment: Comes with historical and projected data for precise calculations.
- Expert-Level Tool: Perfect for financial analysts, investors, and business advisors focusing on Broadcom Inc. (AVGO).
Who Should Use Broadcom Inc. (AVGO)?
- Investors: Make informed investment choices with insights from a leading technology company.
- Financial Analysts: Streamline your analysis with comprehensive data on Broadcom’s market performance.
- Consultants: Easily tailor reports and presentations using Broadcom’s strategic initiatives.
- Tech Enthusiasts: Enhance your knowledge of the semiconductor industry through Broadcom’s innovative solutions.
- Educators and Students: Utilize Broadcom as a case study in technology and finance courses.
What the Template Contains
- Pre-Filled Data: Includes Broadcom Inc.'s historical financials and projections.
- Discounted Cash Flow Model: Editable DCF valuation model featuring automatic calculations.
- Weighted Average Cost of Capital (WACC): A dedicated sheet for calculating WACC using customized inputs.
- Key Financial Ratios: Evaluate Broadcom Inc.'s profitability, efficiency, and leverage metrics.
- Customizable Inputs: Easily modify revenue growth, profit margins, and tax rates.
- Clear Dashboard: Visual representations and tables summarizing essential valuation outcomes.
Disclaimer
All information, articles, and product details provided on this website are for general informational and educational purposes only. We do not claim any ownership over, nor do we intend to infringe upon, any trademarks, copyrights, logos, brand names, or other intellectual property mentioned or depicted on this site. Such intellectual property remains the property of its respective owners, and any references here are made solely for identification or informational purposes, without implying any affiliation, endorsement, or partnership.
We make no representations or warranties, express or implied, regarding the accuracy, completeness, or suitability of any content or products presented. Nothing on this website should be construed as legal, tax, investment, financial, medical, or other professional advice. In addition, no part of this site—including articles or product references—constitutes a solicitation, recommendation, endorsement, advertisement, or offer to buy or sell any securities, franchises, or other financial instruments, particularly in jurisdictions where such activity would be unlawful.
All content is of a general nature and may not address the specific circumstances of any individual or entity. It is not a substitute for professional advice or services. Any actions you take based on the information provided here are strictly at your own risk. You accept full responsibility for any decisions or outcomes arising from your use of this website and agree to release us from any liability in connection with your use of, or reliance upon, the content or products found herein.