
|
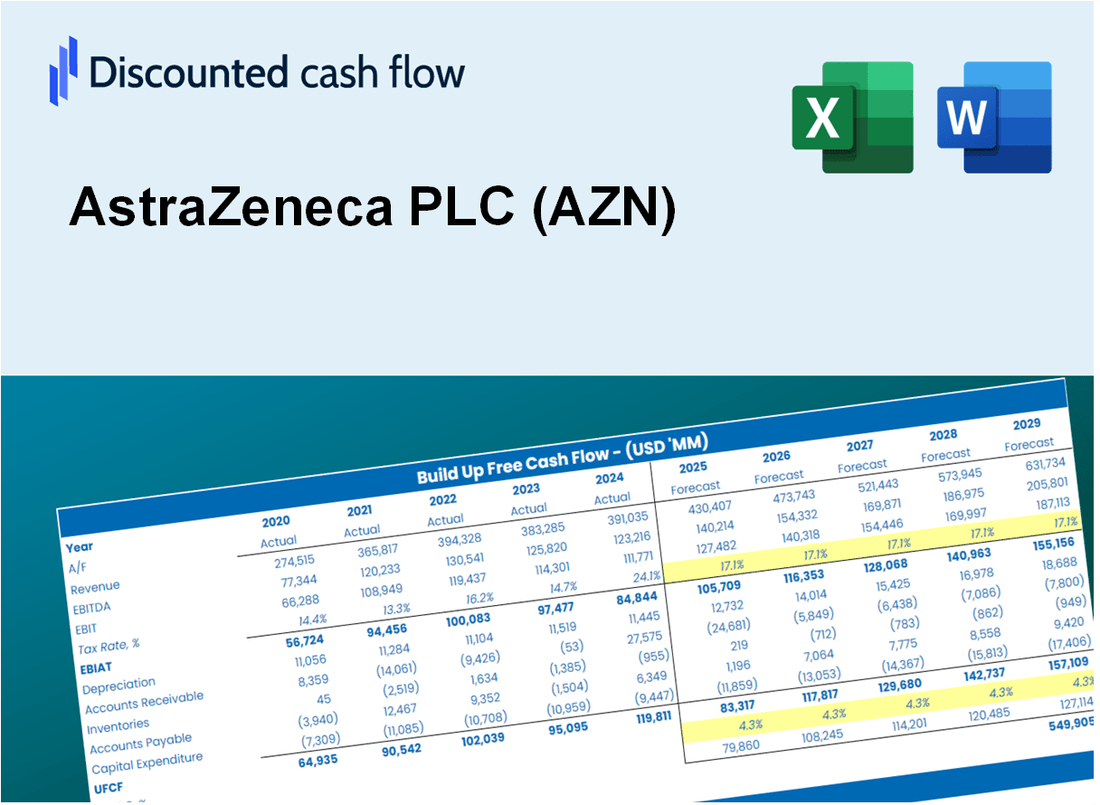
AstraZeneca PLC (AZN) DCF Valuation |
Fully Editable: Tailor To Your Needs In Excel Or Sheets
Professional Design: Trusted, Industry-Standard Templates
Investor-Approved Valuation Models
MAC/PC Compatible, Fully Unlocked
No Expertise Is Needed; Easy To Follow
AstraZeneca PLC (AZN) Bundle
Simplify AstraZeneca PLC (AZN) valuation with this customizable DCF Calculator! Featuring real AstraZeneca PLC (AZN) financials and adjustable forecast inputs, you can test scenarios and uncover AstraZeneca PLC (AZN) fair value in minutes.
Discounted Cash Flow (DCF) - (USD MM)
| Year | AY1 2020 |
AY2 2021 |
AY3 2022 |
AY4 2023 |
AY5 2024 |
FY1 2025 |
FY2 2026 |
FY3 2027 |
FY4 2028 |
FY5 2029 |
|---|---|---|---|---|---|---|---|---|---|---|
| Revenue | 26,617.0 | 37,417.0 | 44,351.0 | 45,811.0 | 54,073.0 | 64,946.3 | 78,006.0 | 93,691.9 | 112,532.0 | 135,160.5 |
| Revenue Growth, % | 0 | 40.58 | 18.53 | 3.29 | 18.03 | 20.11 | 20.11 | 20.11 | 20.11 | 20.11 |
| EBITDA | 8,084.0 | 5,113.0 | 9,085.0 | 13,422.0 | 15,438.0 | 15,894.9 | 19,091.2 | 22,930.1 | 27,541.0 | 33,079.1 |
| EBITDA, % | 30.37 | 13.66 | 20.48 | 29.3 | 28.55 | 24.47 | 24.47 | 24.47 | 24.47 | 24.47 |
| Depreciation | 2,896.0 | 4,102.0 | 5,254.0 | 4,934.0 | 5,065.0 | 6,991.7 | 8,397.6 | 10,086.3 | 12,114.5 | 14,550.5 |
| Depreciation, % | 10.88 | 10.96 | 11.85 | 10.77 | 9.37 | 10.77 | 10.77 | 10.77 | 10.77 | 10.77 |
| EBIT | 5,188.0 | 1,011.0 | 3,831.0 | 8,488.0 | 10,373.0 | 8,903.2 | 10,693.5 | 12,843.8 | 15,426.5 | 18,528.6 |
| EBIT, % | 19.49 | 2.7 | 8.64 | 18.53 | 19.18 | 13.71 | 13.71 | 13.71 | 13.71 | 13.71 |
| Total Cash | 7,992.0 | 6,398.0 | 6,243.0 | 5,860.0 | 5,525.0 | 10,938.4 | 13,137.9 | 15,779.7 | 18,952.8 | 22,764.0 |
| Total Cash, percent | .0 | .0 | .0 | .0 | .0 | .0 | .0 | .0 | .0 | .0 |
| Account Receivables | 5,651.0 | 8,132.0 | 9,192.0 | 8,407.0 | 11,235.0 | 13,355.4 | 16,041.0 | 19,266.6 | 23,140.8 | 27,794.1 |
| Account Receivables, % | 21.23 | 21.73 | 20.73 | 18.35 | 20.78 | 20.56 | 20.56 | 20.56 | 20.56 | 20.56 |
| Inventories | 4,024.0 | 8,983.0 | 4,699.0 | 5,424.0 | 5,288.0 | 9,266.6 | 11,129.9 | 13,368.0 | 16,056.1 | 19,284.8 |
| Inventories, % | 15.12 | 24.01 | 10.6 | 11.84 | 9.78 | 14.27 | 14.27 | 14.27 | 14.27 | 14.27 |
| Accounts Payable | 2,350.0 | 2,824.0 | 2,550.0 | 3,267.0 | 3,640.0 | 4,674.7 | 5,614.7 | 6,743.8 | 8,099.8 | 9,728.6 |
| Accounts Payable, % | 8.83 | 7.55 | 5.75 | 7.13 | 6.73 | 7.2 | 7.2 | 7.2 | 7.2 | 7.2 |
| Capital Expenditure | -2,606.0 | -2,200.0 | -2,571.0 | -3,778.0 | -4,586.0 | -4,961.3 | -5,958.9 | -7,157.2 | -8,596.4 | -10,325.0 |
| Capital Expenditure, % | -9.79 | -5.88 | -5.8 | -8.25 | -8.48 | -7.64 | -7.64 | -7.64 | -7.64 | -7.64 |
| Tax Rate, % | 19.05 | 19.05 | 19.05 | 19.05 | 19.05 | 19.05 | 19.05 | 19.05 | 19.05 | 19.05 |
| EBITAT | 4,234.1 | -427.3 | 5,036.5 | 7,326.6 | 8,396.5 | 6,212.2 | 7,461.4 | 8,961.8 | 10,763.9 | 12,928.4 |
| Depreciation | ||||||||||
| Changes in Account Receivables | ||||||||||
| Changes in Inventories | ||||||||||
| Changes in Accounts Payable | ||||||||||
| Capital Expenditure | ||||||||||
| UFCF | -2,800.9 | -5,491.3 | 10,669.5 | 9,259.6 | 6,556.5 | 3,178.4 | 6,291.2 | 7,556.3 | 9,075.7 | 10,900.7 |
| WACC, % | 4.68 | 4.44 | 4.73 | 4.69 | 4.68 | 4.64 | 4.64 | 4.64 | 4.64 | 4.64 |
| PV UFCF | ||||||||||
| SUM PV UFCF | 31,633.1 | |||||||||
| Long Term Growth Rate, % | 2.00 | |||||||||
| Free cash flow (T + 1) | 11,119 | |||||||||
| Terminal Value | 420,582 | |||||||||
| Present Terminal Value | 335,187 | |||||||||
| Enterprise Value | 366,820 | |||||||||
| Net Debt | 24,626 | |||||||||
| Equity Value | 342,194 | |||||||||
| Diluted Shares Outstanding, MM | 6,252 | |||||||||
| Equity Value Per Share | 54.73 |
What You Will Get
- Comprehensive AZN Financials: Access to historical and projected data for precise valuation.
- Customizable Inputs: Adjust parameters such as WACC, tax rates, revenue growth, and capital expenditures.
- Dynamic Calculations: Intrinsic value and NPV are calculated in real-time.
- Scenario Analysis: Evaluate various scenarios to assess AstraZeneca’s future performance.
- User-Friendly Design: Tailored for professionals while remaining approachable for newcomers.
Key Features
- Customizable Forecast Inputs: Adjust essential metrics such as revenue growth, EBITDA %, and capital investments.
- Instant DCF Valuation: Quickly computes intrinsic value, NPV, and other financial metrics.
- High-Precision Accuracy: Incorporates AstraZeneca’s actual financial data for credible valuation results.
- Effortless Scenario Analysis: Evaluate various assumptions and analyze outcomes with ease.
- Efficiency Booster: Avoid the hassle of creating intricate valuation models from the ground up.
How It Works
- Download: Obtain the pre-built Excel file containing AstraZeneca PLC's (AZN) financial data.
- Customize: Modify projections, including revenue growth, EBITDA %, and WACC.
- Update Automatically: The intrinsic value and NPV calculations refresh in real-time.
- Test Scenarios: Develop various forecasts and compare results instantly.
- Make Decisions: Leverage the valuation insights to inform your investment approach.
Why Choose AstraZeneca PLC (AZN) Calculator?
- Save Time: Instantly access a pre-built DCF model without the hassle of starting from scratch.
- Enhance Accuracy: Utilize dependable financial data and formulas to minimize valuation errors.
- Completely Customizable: Adjust the model to align with your specific assumptions and forecasts.
- User-Friendly: Intuitive charts and outputs simplify the analysis of results.
- Preferred by Professionals: Crafted for experts who prioritize precision and ease of use.
Who Should Use This Product?
- Investors: Evaluate AstraZeneca’s valuation prior to making stock transactions.
- CFOs and Financial Analysts: Enhance valuation workflows and assess financial forecasts.
- Startup Founders: Understand the valuation methods applied to leading public companies like AstraZeneca.
- Consultants: Provide detailed valuation reports for your clients.
- Students and Educators: Utilize real-world examples to practice and teach valuation methodologies.
What the Template Contains
- Comprehensive DCF Model: Editable template with detailed valuation calculations for AstraZeneca PLC (AZN).
- Real-World Data: AstraZeneca's historical and projected financials preloaded for analysis.
- Customizable Parameters: Adjust WACC, growth rates, and tax assumptions to test various scenarios.
- Financial Statements: Full annual and quarterly breakdowns for deeper insights into AstraZeneca's performance.
- Key Ratios: Built-in analysis for profitability, efficiency, and leverage specific to AstraZeneca PLC (AZN).
- Dashboard with Visual Outputs: Charts and tables for clear, actionable results tailored to AstraZeneca PLC (AZN).
Disclaimer
All information, articles, and product details provided on this website are for general informational and educational purposes only. We do not claim any ownership over, nor do we intend to infringe upon, any trademarks, copyrights, logos, brand names, or other intellectual property mentioned or depicted on this site. Such intellectual property remains the property of its respective owners, and any references here are made solely for identification or informational purposes, without implying any affiliation, endorsement, or partnership.
We make no representations or warranties, express or implied, regarding the accuracy, completeness, or suitability of any content or products presented. Nothing on this website should be construed as legal, tax, investment, financial, medical, or other professional advice. In addition, no part of this site—including articles or product references—constitutes a solicitation, recommendation, endorsement, advertisement, or offer to buy or sell any securities, franchises, or other financial instruments, particularly in jurisdictions where such activity would be unlawful.
All content is of a general nature and may not address the specific circumstances of any individual or entity. It is not a substitute for professional advice or services. Any actions you take based on the information provided here are strictly at your own risk. You accept full responsibility for any decisions or outcomes arising from your use of this website and agree to release us from any liability in connection with your use of, or reliance upon, the content or products found herein.