
|
AutoZone, Inc. (AZO) DCF Valuation |
Fully Editable: Tailor To Your Needs In Excel Or Sheets
Professional Design: Trusted, Industry-Standard Templates
Investor-Approved Valuation Models
MAC/PC Compatible, Fully Unlocked
No Expertise Is Needed; Easy To Follow
AutoZone, Inc. (AZO) Bundle
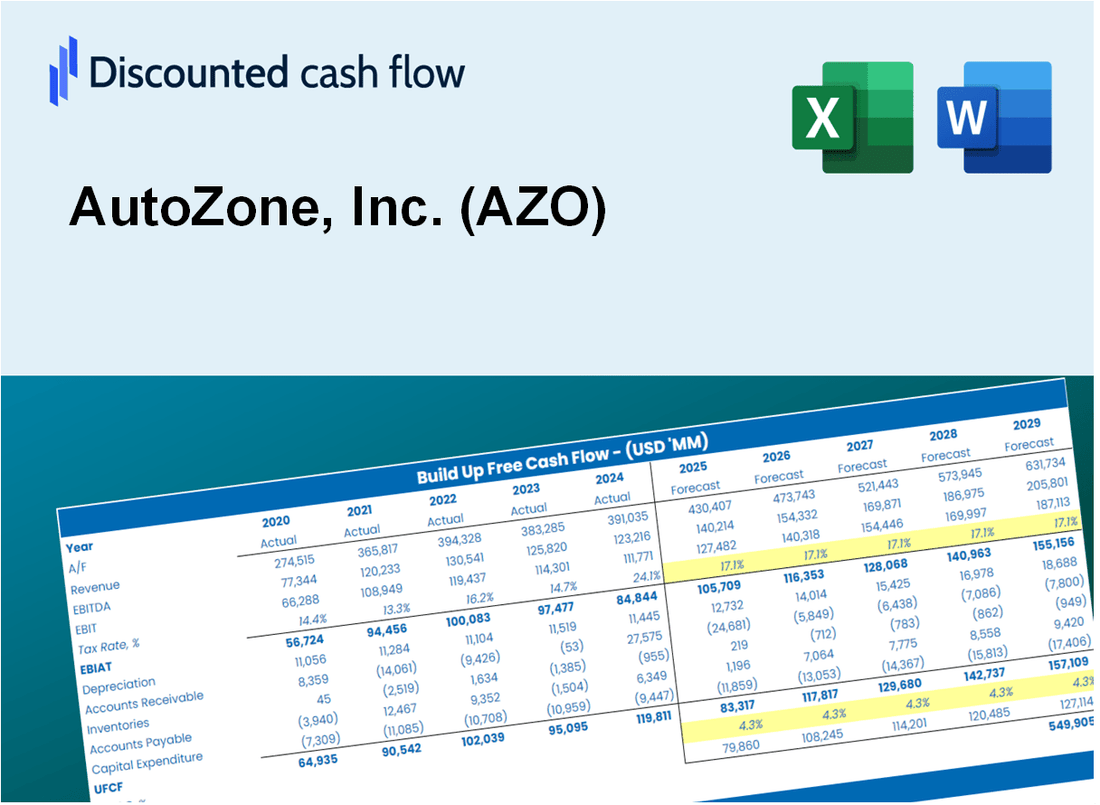
Evaluate AutoZone, Inc.'s (AZO) financial outlook like an expert! This (AZO) DCF Calculator comes with pre-filled financial data and offers full flexibility to modify revenue growth, WACC, margins, and other essential assumptions to align with your projections.
Discounted Cash Flow (DCF) - (USD MM)
| Year | AY1 2021 |
AY2 2022 |
AY3 2023 |
AY4 2024 |
AY5 2025 |
FY1 2026 |
FY2 2027 |
FY3 2028 |
FY4 2029 |
FY5 2030 |
|---|---|---|---|---|---|---|---|---|---|---|
| Revenue | 14,629.6 | 16,252.2 | 17,457.2 | 18,490.3 | 18,938.7 | 20,209.9 | 21,566.4 | 23,014.0 | 24,558.8 | 26,207.2 |
| Revenue Growth, % | 0 | 11.09 | 7.41 | 5.92 | 2.43 | 6.71 | 6.71 | 6.71 | 6.71 | 6.71 |
| EBITDA | 3,357.6 | 3,719.0 | 3,983.6 | 4,349.8 | 4,223.4 | 4,627.2 | 4,937.8 | 5,269.2 | 5,622.9 | 6,000.3 |
| EBITDA, % | 22.95 | 22.88 | 22.82 | 23.52 | 22.3 | 22.9 | 22.9 | 22.9 | 22.9 | 22.9 |
| Depreciation | 407.7 | 442.2 | 497.6 | 549.8 | 613.2 | 588.9 | 628.4 | 670.6 | 715.6 | 763.6 |
| Depreciation, % | 2.79 | 2.72 | 2.85 | 2.97 | 3.24 | 2.91 | 2.91 | 2.91 | 2.91 | 2.91 |
| EBIT | 2,949.9 | 3,276.8 | 3,486.0 | 3,800.0 | 3,610.2 | 4,038.3 | 4,309.4 | 4,598.6 | 4,907.3 | 5,236.7 |
| EBIT, % | 20.16 | 20.16 | 19.97 | 20.55 | 19.06 | 19.98 | 19.98 | 19.98 | 19.98 | 19.98 |
| Total Cash | 1,171.3 | 264.4 | 277.1 | 298.2 | 271.8 | 576.7 | 615.4 | 656.7 | 700.8 | 747.9 |
| Total Cash, percent | .0 | .0 | .0 | .0 | .0 | .0 | .0 | .0 | .0 | .0 |
| Account Receivables | 378.4 | 504.9 | 520.4 | 545.6 | 670.1 | 612.9 | 654.0 | 697.9 | 744.8 | 794.8 |
| Account Receivables, % | 2.59 | 3.11 | 2.98 | 2.95 | 3.54 | 3.03 | 3.03 | 3.03 | 3.03 | 3.03 |
| Inventories | 4,639.8 | 5,638.0 | 5,764.1 | 6,155.2 | 7,025.7 | 6,863.7 | 7,324.4 | 7,816.0 | 8,340.7 | 8,900.5 |
| Inventories, % | 31.72 | 34.69 | 33.02 | 33.29 | 37.1 | 33.96 | 33.96 | 33.96 | 33.96 | 33.96 |
| Accounts Payable | 6,013.9 | 7,301.3 | 7,201.3 | 7,355.7 | 8,025.6 | 8,465.6 | 9,033.9 | 9,640.2 | 10,287.3 | 10,977.8 |
| Accounts Payable, % | 41.11 | 44.93 | 41.25 | 39.78 | 42.38 | 41.89 | 41.89 | 41.89 | 41.89 | 41.89 |
| Capital Expenditure | -621.8 | -672.4 | -796.7 | -1,072.7 | -1,327.3 | -1,041.2 | -1,111.1 | -1,185.7 | -1,265.3 | -1,350.2 |
| Capital Expenditure, % | -4.25 | -4.14 | -4.56 | -5.8 | -7.01 | -5.15 | -5.15 | -5.15 | -5.15 | -5.15 |
| Tax Rate, % | 20.29 | 20.29 | 20.29 | 20.29 | 20.29 | 20.29 | 20.29 | 20.29 | 20.29 | 20.29 |
| EBITAT | 2,328.8 | 2,585.6 | 2,782.6 | 3,031.7 | 2,877.5 | 3,207.7 | 3,423.0 | 3,652.8 | 3,898.0 | 4,159.6 |
| Depreciation | ||||||||||
| Changes in Account Receivables | ||||||||||
| Changes in Inventories | ||||||||||
| Changes in Accounts Payable | ||||||||||
| Capital Expenditure | ||||||||||
| UFCF | 3,110.4 | 2,518.2 | 2,241.8 | 2,246.9 | 1,838.3 | 3,414.6 | 3,006.7 | 3,208.5 | 3,423.9 | 3,653.7 |
| WACC, % | 5.27 | 5.27 | 5.28 | 5.28 | 5.28 | 5.28 | 5.28 | 5.28 | 5.28 | 5.28 |
| PV UFCF | ||||||||||
| SUM PV UFCF | 14,318.5 | |||||||||
| Long Term Growth Rate, % | 3.00 | |||||||||
| Free cash flow (T + 1) | 3,763 | |||||||||
| Terminal Value | 165,254 | |||||||||
| Present Terminal Value | 127,785 | |||||||||
| Enterprise Value | 142,103 | |||||||||
| Net Debt | 11,905 | |||||||||
| Equity Value | 130,198 | |||||||||
| Diluted Shares Outstanding, MM | 17 | |||||||||
| Equity Value Per Share | 7,549.89 |
What You Will Get
- Editable Excel Template: A fully customizable Excel-based DCF Calculator featuring pre-filled real AutoZone (AZO) financials.
- Real-World Data: Historical data and forward-looking estimates (highlighted in the yellow cells).
- Forecast Flexibility: Adjust forecast assumptions such as revenue growth, EBITDA %, and WACC.
- Automatic Calculations: Instantly observe the effect of your inputs on AutoZone’s valuation.
- Professional Tool: Designed for investors, CFOs, consultants, and financial analysts.
- User-Friendly Design: Organized for clarity and ease of use, complete with step-by-step instructions.
Key Features
- Real-Life AZO Data: Pre-filled with AutoZone’s historical financials and future projections.
- Fully Customizable Inputs: Adjust revenue growth, profit margins, WACC, tax rates, and capital expenditures.
- Dynamic Valuation Model: Automatic updates to Net Present Value (NPV) and intrinsic value based on your inputs.
- Scenario Testing: Create multiple forecast scenarios to evaluate various valuation outcomes.
- User-Friendly Design: Intuitive, structured, and crafted for both professionals and novices.
How It Works
- Step 1: Download the prebuilt Excel template featuring AutoZone’s data included.
- Step 2: Navigate through the pre-filled sheets to familiarize yourself with the key metrics.
- Step 3: Adjust forecasts and assumptions in the editable yellow cells (WACC, growth, margins).
- Step 4: Instantly view recalculated results, including AutoZone’s intrinsic value.
- Step 5: Make informed investment decisions or create reports based on the outputs.
Why Choose This Calculator for AutoZone, Inc. (AZO)?
- Accurate Data: Access real AutoZone financials for dependable valuation outcomes.
- Customizable: Modify essential parameters such as growth rates, WACC, and tax rates to align with your forecasts.
- Time-Saving: Pre-configured calculations save you the hassle of starting from the ground up.
- Professional-Grade Tool: Tailored for investors, analysts, and consultants in the automotive sector.
- User-Friendly: An intuitive design with clear instructions ensures ease of use for everyone.
Who Should Use This Product?
- Automotive Students: Explore vehicle valuation techniques and apply them using real market data.
- Researchers: Integrate industry models into academic projects or studies.
- Investors: Validate your investment strategies and analyze valuation outcomes for AutoZone, Inc. (AZO).
- Market Analysts: Enhance your analysis process with a customizable financial model tailored for AutoZone.
- Independent Repair Shop Owners: Understand how major retailers like AutoZone are evaluated in the market.
What the Template Contains
- Pre-Filled DCF Model: AutoZone’s financial data preloaded for immediate use.
- WACC Calculator: Detailed calculations for Weighted Average Cost of Capital.
- Financial Ratios: Evaluate AutoZone’s profitability, leverage, and efficiency.
- Editable Inputs: Change assumptions such as growth, margins, and CAPEX to fit your scenarios.
- Financial Statements: Annual and quarterly reports to support detailed analysis.
- Interactive Dashboard: Easily visualize key valuation metrics and results.
Disclaimer
All information, articles, and product details provided on this website are for general informational and educational purposes only. We do not claim any ownership over, nor do we intend to infringe upon, any trademarks, copyrights, logos, brand names, or other intellectual property mentioned or depicted on this site. Such intellectual property remains the property of its respective owners, and any references here are made solely for identification or informational purposes, without implying any affiliation, endorsement, or partnership.
We make no representations or warranties, express or implied, regarding the accuracy, completeness, or suitability of any content or products presented. Nothing on this website should be construed as legal, tax, investment, financial, medical, or other professional advice. In addition, no part of this site—including articles or product references—constitutes a solicitation, recommendation, endorsement, advertisement, or offer to buy or sell any securities, franchises, or other financial instruments, particularly in jurisdictions where such activity would be unlawful.
All content is of a general nature and may not address the specific circumstances of any individual or entity. It is not a substitute for professional advice or services. Any actions you take based on the information provided here are strictly at your own risk. You accept full responsibility for any decisions or outcomes arising from your use of this website and agree to release us from any liability in connection with your use of, or reliance upon, the content or products found herein.