
|
Aspen Technology, Inc. (AZPN): 5 FORCES Analysis [Nov-2025 Updated] |
Fully Editable: Tailor To Your Needs In Excel Or Sheets
Professional Design: Trusted, Industry-Standard Templates
Investor-Approved Valuation Models
MAC/PC Compatible, Fully Unlocked
No Expertise Is Needed; Easy To Follow
Aspen Technology, Inc. (AZPN) Bundle
You're trying to size up the competitive moat around Aspen Technology, Inc. as we hit late 2025, and honestly, it's a classic case of deep specialization fighting against broad industrial power. While the company enjoys incredible customer stickiness-evidenced by that $964.9 million Annual Contract Value in Q2 FY2025-and defends a strong 62% share in process simulation, the rivalry with giants like Siemens and Honeywell is definitely heating up, especially as competition shifts to AI/ML optimization. High barriers to entry protect them from startups, but you need to understand where the pressure points are, from supplier power in specialized engineering talent to the leverage held by their massive enterprise customers. Dive in below to see my breakdown of all five forces, mapping out the near-term risks and opportunities you need to track.
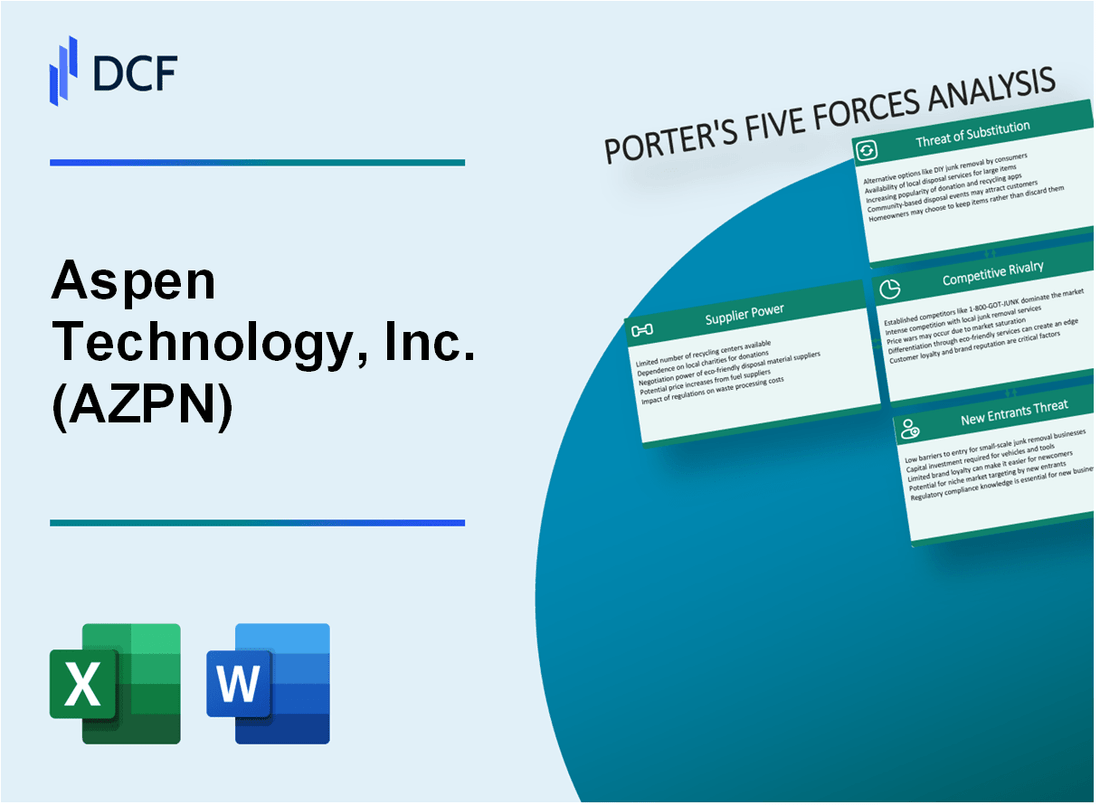
Aspen Technology, Inc. (AZPN) - Porter's Five Forces: Bargaining power of suppliers
When you look at the suppliers for Aspen Technology, Inc., you have to split the analysis into two buckets: the commodity inputs and the specialized human capital, plus the unique situation with its owner. For the generic inputs-things like cloud services or standard hardware components-the bargaining power of those suppliers remains low because those markets are highly competitive and commoditized. You aren't paying a premium for a basic server or a standard cloud instance; the market sets that price.
The real cost pressure comes from the talent pool. The primary supplier here isn't a vendor; it's the high-specialty engineering and AI talent required to build and maintain Aspen Technology, Inc.'s complex simulation and optimization software. This expertise commands a significant premium in the market, directly impacting the cost structure for internal development and, by extension, the cost of future product delivery.
The dynamic with Emerson Electric Co. is now fundamentally different than it was in the past. Before March 2025, Emerson, which held approximately 57% of Aspen Technology, Inc.'s outstanding shares, acted as a massive strategic partner, which inherently reduced external supply chain risk from a majority ownership standpoint. However, as of March 12, 2025, Emerson completed its acquisition, making Aspen Technology, Inc. a wholly owned subsidiary. This means the 'bargaining power of suppliers' related to Emerson has effectively been internalized, transforming a strategic partnership into an internal resource allocation decision, though the legacy of that deep integration remains.
To keep its technology edge sharp, Aspen Technology, Inc.'s R&D spend is substantial. This continuous investment is necessary to maintain product leadership and fend off substitutes. For instance, in the full fiscal year 2024, the company spent $347.8 million on research and development. This commitment shows the internal cost of innovation. Furthermore, Aspen Technology, Inc. actively manages its technology supply chain through strategic M&A. A concrete example is the acquisition of Open Grid Systems Limited in Q2 FY2025, which was secured for a net cash payment of $36.5 million at closing. This move was explicitly about securing niche technology and domain expertise, showing a proactive approach to internalizing critical capabilities.
Here's a quick look at the financial scale related to internal investment and recent strategic 'supply' acquisition:
| Metric | Amount/Value | Context/Period |
|---|---|---|
| FY 2024 R&D Expense | $347.8 million | Full Fiscal Year 2024 Spend |
| Q1 FY2025 R&D Expense | $53.676 million | Three months ended September 30, 2024 (assuming thousands) |
| Open Grid Systems Net Acquisition Cost | $36.5 million | Net cash paid at closing in Q2 FY2025 |
| Pre-Acquisition Emerson Stake | 57% | Approximate ownership prior to March 2025 closing |
| Q2 FY2025 Total Revenue | $303.6 million | Quarter ended December 31, 2024 |
You can see the internal pressure points clearly when you review the talent and acquisition costs. The company has to continuously spend to keep its core offering relevant. The reliance on internal development is high, which means the cost of specialized labor is a major factor in supplier power analysis, even if traditional vendors are weak.
The strategic use of cash to buy expertise highlights a key mitigation strategy:
- Acquiring Open Grid Systems to bolster Digital Grid Management (DGM) suite.
- Integrating Plantweb Optics Analytics IP from Emerson to enhance APM products.
- Continuous investment in internal technology development to offset external talent costs.
It's a constant balancing act between buying specialized capability and developing it internally, but the talent market definitely has the upper hand on pricing for the best people. That's the real leverage point for suppliers of human capital.
Aspen Technology, Inc. (AZPN) - Porter's Five Forces: Bargaining power of customers
You're looking at the customer side of the equation for Aspen Technology, Inc. (AZPN), and honestly, the power dynamic here leans toward the buyer, but it's complicated by high barriers to exit. Customers are massive, asset-intensive firms, primarily in sectors like Oil & Energy, where they represent about 18% of the customer base, alongside Chemicals and Utilities. These aren't small players; the majority of Aspen Technology, Inc.'s (AZPN) customer base consists of large enterprises, specifically 233 companies that employ 10,000+ employees.
Switching costs are what really keeps the power somewhat in check for Aspen Technology, Inc. (AZPN). The aspenONE platform is deeply integrated into mission-critical operations, meaning ripping it out to try a competitor is a massive, risky undertaking. For example, you see this with utilities like Interconexión Eléctrica S.A. E.S.P. (ISA), which relies on Aspen Technology, Inc. (AZPN)'s Digital Grid Management (DGM) solutions to maintain 99.99% power transmission reliability across approximately 16,395 miles of circuit in Latin America. That level of operational dependence is your moat, but it doesn't stop the biggest whales from pushing on price.
Here's a quick look at the customer base profile as of late 2025:
| Customer Segment Characteristic | Data Point | Source Context |
|---|---|---|
| Primary Industries | Oil & Energy, Chemicals, Utilities | Outline Requirement |
| Oil & Energy Customer Share (as per outline) | 18% | Outline Requirement |
| Large Enterprise Count (10,000+ employees) | 233 companies | |
| Total Companies Using Software (Global) | Over 785 companies | |
| Deep Integration Factor | Mission-critical operations | Outline Requirement |
Still, when those major license renewals come up, the sheer size of these customers gives them leverage. They know how much it costs you to lose them, even if replacing you is harder. This dynamic is reflected in the recurring revenue metrics, which show the stickiness of the installed base.
The Annual Contract Value (ACV) is a great indicator of this recurring commitment. For the second quarter of fiscal 2025, the ACV reached $964.9 million, showing a 9.2% year-over-year increase. That recurring revenue stream is what you use to counter their negotiation tactics, but you have to watch the timing.
Consider these key recurring revenue figures from Q2 FY2025:
- Annual Contract Value (ACV) as of Q2 FY2025: $964.9 million
- ACV Year-over-Year Growth: 9.2%
- ACV Quarter-over-Quarter Growth: 2.5%
- Total Revenue in Q2 FY2025: $303.6 million
- Total Bookings in Q2 FY2025: $307.5 million
To be fair, the macro environment plays a role in how aggressively they negotiate. Management noted in late 2024 that uncertainty plays a big role in CEO budget decisions, but they expected that to decrease as interest rates looked to come down, potentially creating a more favorable environment for investments heading into calendar '25. However, the fact that the merger agreement with Emerson Electric Co. was announced in January 2025, with a tender offer closing in March 2025, definitely shifts the near-term negotiation landscape, as the future ownership structure was a major factor for large customers.
| Financial Metric (Q2 FY2025) | Amount | Comparison to Q2 FY2024 |
|---|---|---|
| Annual Contract Value (ACV) | $964.9 million | Increased 9.2% YoY |
| Total Revenue | $303.6 million | Up from $257.2 million |
| Bookings | $307.5 million | Up from $233.4 million |
| Cash Flow from Operations | $38.1 million | Up from $29.8 million |
Aspen Technology, Inc. (AZPN) - Porter's Five Forces: Competitive rivalry
Rivalry within the industrial software space, particularly for process simulation, is defintely intense. You are competing against large, diversified industrial giants that possess massive financial and resource war chests. These rivals can absorb R&D costs and cross-subsidize product lines in ways a more focused entity like Aspen Technology, Inc. cannot always match.
Key competitors include Siemens, Honeywell International Inc., and AVEVA Group plc. To give you a sense of scale, Siemens reported revenue of €19.4 billion in Q3 2025 [cite: 6, second search], and Honeywell reported revenue of USD 36.66 billion in 2023 [cite: 8, second search]. Compare that to Aspen Technology, Inc.'s total revenue of $303.6 million for the second quarter of fiscal 2025 (period ending December 31, 2024) [cite: 1, first search].
Here's a quick look at the revenue scale of some of the major industrial players, though direct apples-to-apples comparison for just the process simulation segment is difficult:
| Company | Latest Reported Revenue Figure | Date/Period |
| Siemens AG | €19.4 billion | Q3 2025 [cite: 6, second search] |
| Honeywell International Inc. | USD 36.66 billion | 2023 [cite: 8, second search] |
| Aspen Technology, Inc. (TTM Revenue) | $1.14 Billion USD | As of December 31, 2024 [cite: 12, second search] |
Still, Aspen Technology, Inc. maintains a strong niche position. Its Aspen HYSYS product is called the market-leading process simulator for the oil and gas sector [cite: 4, second search]. While the specific 62% market share figure for process simulation software isn't confirmed in the latest data, the company is ranked 1st among 614 active competitors overall [cite: 2, first search].
The market structure itself is changing due to consolidation. Emerson Electric Co.'s ownership, culminating in the merger agreement announced January 26, 2025, and the subsequent delisting on May 14, 2025, creates a powerful, integrated competitor that spans more of the industrial technology stack [cite: 1, first search, 3, second search]. This integration means rivalry is now fought on a broader platform level.
Competition is rapidly shifting toward next-generation capabilities. You need to watch the race in AI/ML-driven optimization and sustainability solutions, which requires significant, sustained R&D investment. Aspen Technology, Inc. is prioritizing these areas, noting that its Digital Grid Management (DGM) suite experienced approximately 40% growth in fiscal 2024 [cite: 2, second search]. The company is confident in delivering high-single-digits to double-digits Annual Contract Value (ACV) growth for fiscal 2025, supported by these strategic initiatives [cite: 11, first search].
The competitive dynamics are shaped by these key factors:
- Rivalry from giants like Siemens and Honeywell with revenues in the tens of billions.
- Aspen Technology, Inc. holding the market-leading position in process simulation.
- The market for process simulation and optimization is estimated at $2.5B in 2025.
- The Emerson integration creates a more formidable, vertically aligned competitor.
- Focus areas driving competition include Industrial AI and sustainability pathways.
Finance: draft the projected R&D spend for H1 2026 based on the fiscal 2025 ACV margin target of 45-47% by next Tuesday.
Aspen Technology, Inc. (AZPN) - Porter's Five Forces: Threat of substitutes
You're analyzing the substitutes for Aspen Technology, Inc. (AZPN) offerings, and it's clear that while direct, full-scale functional replacement is tough, several paths exist for customers to avoid your specialized software. The threat here isn't an immediate, perfect competitor, but rather the customer's decision to build or pivot to less specialized tools.
In-house development by large customers is definitely a substitute, but it's a massive undertaking. Building a comparable system means absorbing the full spectrum of costs: initial development, ongoing maintenance, training for specialized internal teams, and the opportunity cost of diverting top engineering talent. For instance, when considering a 'build vs. buy' decision for complex platforms, leaders must evaluate hidden costs that can cause direct and indirect expenses to skyrocket from initial concepting through deployment and scale. This internal build path requires specialized expertise that Aspen Technology, Inc. has spent decades accumulating.
Generic Enterprise Asset Management (EAM) or ERP systems, like those from SAP, can substitute for some functions, particularly routine maintenance scheduling or basic inventory tracking within the broader enterprise suite. However, these general systems often lack the granular, process-specific depth that drives core operational value for Aspen Technology, Inc.'s clients. The EAM market itself is large and growing, indicating that asset management software is a priority, but this doesn't automatically mean substitution for process optimization.
The substitution threat is fundamentally limited by the deep, proprietary domain models embedded in Aspen Technology, Inc.'s process optimization software. Products like Aspen Plus® and Aspen HYSYS® rely on models built on centuries of combined process engineering knowledge, validated over four decades of industry use. These models leverage the laws of chemistry and physics to generate simulated data, which is crucial for filling gaps in historical or real-time asset data, something generic tools cannot replicate with the same fidelity.
The high financial stakes of operational failure strongly favor proven platforms like those from Aspen Technology, Inc. over unproven substitutes. For industrial organizations, a cyber incident can be catastrophic, making platform security and reliability paramount. The average total cost of a data breach in the industrial sector was $5.56 million in 2024, which was 13% more than the global average at that time. Furthermore, unplanned downtime, often a consequence of system failure or attack, can cost up to $125,000 per hour in the industrial sector. This risk profile clearly pushes customers toward established, secure solutions.
The rise of generalized AI/ML tools presents a long-term, evolving threat if they can be easily adapted to process data without requiring deep engineering context. To put this trend in perspective, industry executives are making significant bets: 50% of them expect AI to drive transformation in their organization, and these same executives plan to invest more than 25% of their total budgets on AI solutions by 2025. Aspen Technology, Inc.'s strategy to counter this involves embedding AI within its domain-rich models, creating a 'hybrid modeling' system that places scientific guardrails around the algorithms, which helps mitigate the risk of inaccurate results from generalized tools.
Here's a quick look at the market context that frames the substitution pressure:
| Metric | Value / Context | Source Year/Period |
|---|---|---|
| Global EAM Market Size | $6.09 billion | 2024 |
| Projected EAM Market Size | $6.65 billion | 2025 |
| Industrial Sector Data Breach Cost (Average) | $5.56 million | 2024 |
| Industrial Downtime Cost (Per Hour Estimate) | Up to $125,000 | Recent Reports |
| Executives Investing >25% of Budget in AI | 50% of Industry Executives | 2025 Forecast |
| Large Enterprise Share of EAM Revenue | 57.49% | 2024 |
The key functional areas where substitutes are less effective relate directly to Aspen Technology, Inc.'s core IP:
- Modeling equipment difficult via first principles.
- Developing models without expert modeling skills.
- Optimizing optionality across multiple assets.
- Ensuring AI results have engineering guardrails.
- Capturing best practice designs for reuse.
Finance: draft a sensitivity analysis on the impact of a 10% shift in large enterprise EAM spending toward generic ERPs by Q2 2026, due Friday.
Aspen Technology, Inc. (AZPN) - Porter's Five Forces: Threat of new entrants
Barriers to entry are very high due to the need for deep, specialized industrial domain knowledge. Aspen Technology, Inc.'s customer base shows a strong concentration in process industries; for example, 18% of its customers are in the Oil & Energy sector, with 8% in Chemicals, as of late 2025 data.
Significant capital is required for R&D in AI, Digital Twins, and cloud-native industrial solutions. New entrants face high initial investment hurdles, particularly in complex areas like Digital Twin integration, where high initial investment is a confirmed barrier. Aspen Technology, Inc. is focused on continuous innovation, including Industrial AI, and reaffirmed its fiscal 2025 Annual Contract Value (ACV) growth guidance of ~9.0% year-over-year.
New entrants face long sales cycles and difficulty integrating with complex, legacy operational technology (OT) systems. For enterprise software, the average sales cycle length typically ranges from 6-9 months. The challenge of achieving IT/OT synergies, due to unfamiliar data types and legacy environments, is a key obstacle for scaling Industry 4.0 initiatives, which Aspen Technology, Inc.'s solutions address.
The company's installed base and proprietary data create a network effect that is defintely hard to replicate. As of late 2025, around 785 companies globally use Aspen Technology, Inc. as an enterprise asset management software tool. A significant portion of these are large enterprises, with 233 customers having 10,000+ employees.
Regulatory compliance and safety standards in industries like Oil & Gas and Chemicals are major hurdles for startups. These highly regulated sectors demand proven, compliant solutions, which favors established vendors with deep domain expertise.
Here's a quick look at some relevant financial and operational metrics:
| Metric | Value (Late 2025 Data) | Context/Period |
| Global Customer Count (Est.) | 785 | 2025 (Enterprise Asset Management Software Users) |
| Largest Customer Segment Size | 233 Companies | Customers with 10,000+ Employees |
| Q2 Fiscal Year 2025 Total Revenue | $303.6 million | Second Quarter of Fiscal 2025 |
| Q2 Fiscal Year 2025 Annual Contract Value (ACV) | $964.9 million | Second Quarter of Fiscal 2025 |
| Target ACV Margin (Operating Model) | 45-47% | Multi-year Outlook |
| Average Enterprise SaaS Sales Cycle (Benchmark) | 6-9 months | Industry Benchmark |
The barriers are compounded by the nature of the installed base:
- High concentration in Oil & Energy (18%).
- Large customer size skew: 51% of users have over 1,000 employees.
- Digital Twin integration requires overcoming high initial investment.
- IT/OT interoperability remains a key obstacle for many organizations.
- The company's ACV growth guidance for fiscal 2025 was ~9.0% year-over-year.
Disclaimer
All information, articles, and product details provided on this website are for general informational and educational purposes only. We do not claim any ownership over, nor do we intend to infringe upon, any trademarks, copyrights, logos, brand names, or other intellectual property mentioned or depicted on this site. Such intellectual property remains the property of its respective owners, and any references here are made solely for identification or informational purposes, without implying any affiliation, endorsement, or partnership.
We make no representations or warranties, express or implied, regarding the accuracy, completeness, or suitability of any content or products presented. Nothing on this website should be construed as legal, tax, investment, financial, medical, or other professional advice. In addition, no part of this site—including articles or product references—constitutes a solicitation, recommendation, endorsement, advertisement, or offer to buy or sell any securities, franchises, or other financial instruments, particularly in jurisdictions where such activity would be unlawful.
All content is of a general nature and may not address the specific circumstances of any individual or entity. It is not a substitute for professional advice or services. Any actions you take based on the information provided here are strictly at your own risk. You accept full responsibility for any decisions or outcomes arising from your use of this website and agree to release us from any liability in connection with your use of, or reliance upon, the content or products found herein.