
|
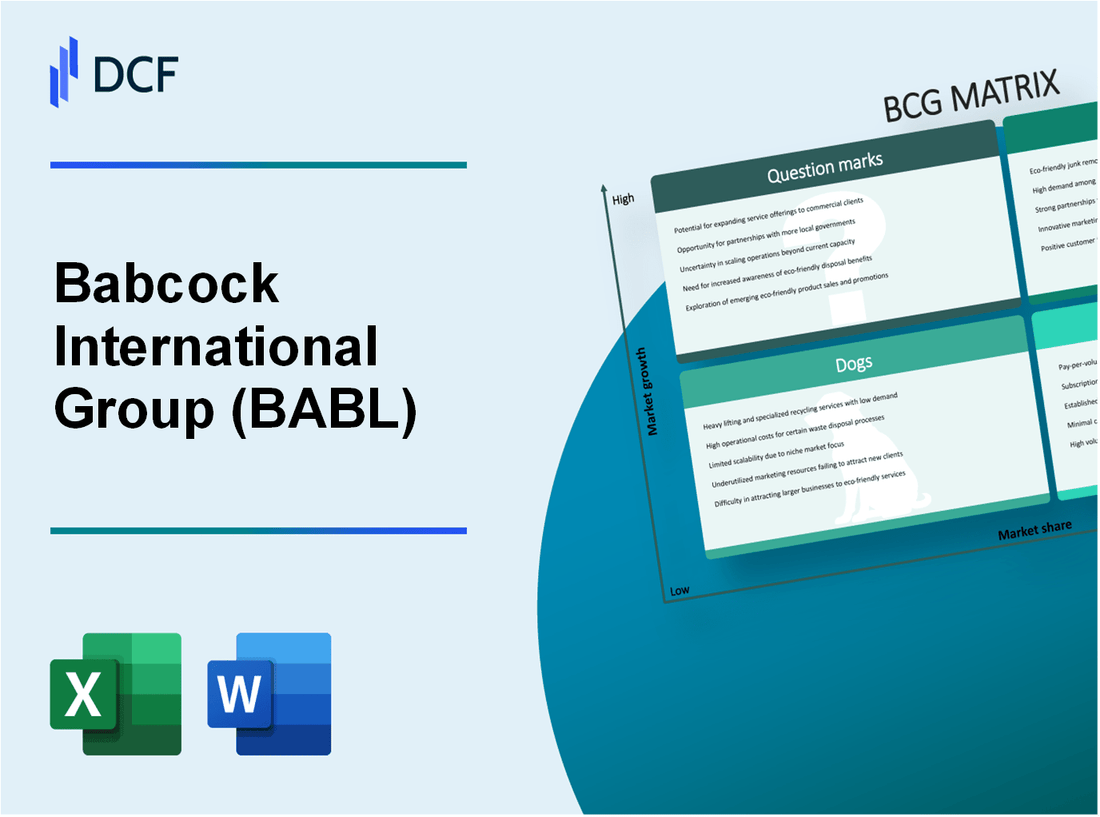
Babcock International Group PLC (BAB.L): BCG Matrix |
Fully Editable: Tailor To Your Needs In Excel Or Sheets
Professional Design: Trusted, Industry-Standard Templates
Investor-Approved Valuation Models
MAC/PC Compatible, Fully Unlocked
No Expertise Is Needed; Easy To Follow
Babcock International Group PLC (BAB.L) Bundle
In the dynamic world of defense and engineering, Babcock International Group PLC stands out with its diverse portfolio, each segment playing a crucial role in its overall strategy. Utilizing the Boston Consulting Group Matrix, we categorize their operations into Stars, Cash Cows, Dogs, and Question Marks, offering a clear picture of where the company excels and where it faces challenges. Dive into the details below to discover how these classifications shape Babcock's future and investment potential.
Background of Babcock International Group PLC
Babcock International Group PLC is a prominent British multinational corporation that specializes in the provision of critical services to various sectors, including defense, emergency services, and civil nuclear. Founded in 1891, Babcock has evolved into a key player in the engineering and support services industry, boasting a diverse portfolio that enhances operational efficiency for its clients.
As of the fiscal year ended March 2023, Babcock reported revenues of approximately £5.2 billion, reflecting its robust performance across its strategic divisions. The company's operations are predominantly concentrated in the United Kingdom, although it also has significant international engagements, particularly in Europe, North America, and Australia.
Babcock's business model revolves around long-term contracts and relationships with government bodies and private enterprises, primarily focusing on sustaining and modernizing critical infrastructure. Notably, the defense segment remains a cornerstone of its offerings, accounting for a substantial portion of its revenue, driven by contracts with the UK Ministry of Defence.
In recent years, Babcock has undertaken initiatives aimed at restructuring and streamlining its operations. This includes divesting non-core assets and enhancing its core capabilities in engineering and technical services. The strategy is geared towards improving profitability and operational effectiveness, amidst a competitive landscape characterized by evolving market demands.
The company is also committed to embracing innovation and digital transformation, investing in new technologies aimed at enhancing its service delivery and operational processes. Babcock’s focus on sustainability and reducing its environmental footprint has become increasingly important, aligning with global trends toward sustainable practices in business.
Babcock International Group PLC trades on the London Stock Exchange under the ticker symbol BAB. Its stock performance has experienced fluctuations over the years; however, the company's recent strategies and market position indicate a potential for recovery and growth in the upcoming periods.
Babcock International Group PLC - BCG Matrix: Stars
Defense and Security Contracts
Babcock International Group PLC is a prominent player in the defense sector, securing substantial contracts that underscore its role as a leader. In the fiscal year ending 2022, the company reported revenues of approximately £4.4 billion, with a significant portion attributed to defense contracts. The UK Ministry of Defence (MOD) has awarded Babcock a series of contracts totaling £1.5 billion for various naval vessel sustainment projects.
Moreover, Babcock was selected for the Land and Aerospace Sector's support contracts, contributing to their position in high-growth markets. The company’s backlog for defense-related contracts was valued at around £3 billion as of March 2023, indicating robust future revenue potential.
International Partnerships
Babcock's strategic international partnerships bolster its position within the Stars quadrant. The collaboration with the Australian Government led to a contract worth £1.2 billion for the delivery of naval capabilities. Additionally, partnerships with international firms in Europe and North America have generated revenue streams that contributed to a 20% increase in international sales over the past year.
In 2022, Babcock also expanded its reach in Canada through a partnership worth approximately £0.75 billion, enhancing its portfolio in the international defense market. These international ventures are crucial for maintaining high market share in an expanding global military market.
Nuclear Services
Babcock’s Nuclear Services sector is another key area classified as a Star, showing consistent growth with high market share. The nuclear business segment generated revenues of £1 billion in FY 2022, driven by contracts like the £400 million contract for the decommissioning of Magnox sites, which represents a significant part of its nuclear operations.
The latest contract awarded in 2023 for reactor support services is valued at £500 million, which is anticipated to further enhance cash flows. Babcock's investments in this segment have resulted in a market share of approximately 30% in the UK nuclear decommissioning sector, positioning it as a leading supplier in a market expected to grow at a CAGR of 5.4% through 2026.
| Category | Revenue (£) | Contract Value (£) | Market Share (%) | Future Growth Rate (%) |
|---|---|---|---|---|
| Defense Contracts | 4.4 billion | 1.5 billion (MOD contracts) | N/A | N/A |
| International Partnerships | N/A | 1.2 billion (Australia) | 20% | N/A |
| Nuclear Services | 1 billion | 400 million (Magnox decommissioning) | 30% | 5.4% |
Overall, Babcock International Group PLC's strategies in defense, international partnerships, and nuclear services place it firmly in the Stars quadrant of the BCG Matrix, positioned for sustained growth and profitability while maintaining a strong market presence in these high-growth sectors.
Babcock International Group PLC - BCG Matrix: Cash Cows
Babcock International Group PLC operates several segments that can be classified as Cash Cows within the BCG Matrix framework, contributing significantly to the company's profitability with strong market positions in mature sectors. The following segments exemplify this classification.
Marine Engineering Services
The Marine Engineering Services division is a cornerstone of Babcock's operations, securing a substantial share in a well-established market. This segment offers comprehensive support for naval and maritime operations, including maintenance, repair, and operational readiness of vessels.
In the latest financial report, this division generated revenues of approximately £1.1 billion. The profit margins for this segment stand at around 20%, illustrating the high profitability characteristic of Cash Cows. Given the mature nature of this market, Babcock expects low growth projections, averaging 3% annually over the next five years.
Support and Maintenance Services
Support and Maintenance Services encompass a variety of offerings across industrial and infrastructure sectors, including the management of assets and equipment. This segment has consistently demonstrated high market share, allowing it to maintain healthy cash flow.
In FY 2023, revenues from this sector reached around £800 million, with an impressive operating margin of 18%. Due to the underlying maturity of the market, growth rates are projected to stagnate at around 2.5% per annum. This indicates that while the segment does not exhibit rapid expansion, it is critical in providing stable cash inflows for Babcock.
Training and Technical Consultancy
The Training and Technical Consultancy segment, which includes specialized training for defense and operational excellence, serves as another key Cash Cow for Babcock. This segment has established a strong reputation and a loyal client base in the UK and internationally.
Recent figures show that this division's revenue totaled approximately £600 million in 2023, with a profit margin of around 25%. The growth prospects remain muted due to market saturation, with expectations set at 3% annually, reinforcing its status as a cash-producing entity.
| Segment | Revenue (£ million) | Profit Margin (%) | Growth Rate (%) |
|---|---|---|---|
| Marine Engineering Services | 1,100 | 20 | 3 |
| Support and Maintenance Services | 800 | 18 | 2.5 |
| Training and Technical Consultancy | 600 | 25 | 3 |
These Cash Cow segments ensure Babcock International Group PLC can fund growth initiatives elsewhere in the company, such as emerging areas represented by Question Marks, thereby strengthening its overall market position with consistent revenue and effective cash flow management.
Babcock International Group PLC - BCG Matrix: Dogs
Legacy Manufacturing Operations
Babcock International Group has notable legacy manufacturing operations that have been associated with low growth markets. In the fiscal year ending March 2023, the revenue contribution from these legacy operations was approximately £300 million, reflecting a decline of 5% year-over-year. This segment has faced challenges in adapting to modern industry standards, with operational inefficiencies leading to a 3.5% margin compared to the group average margin of 7%.
Low-Demand Geographic Markets
The company has been active in various geographic markets; however, certain regions exhibit low demand for its services. For instance, the South African market, where Babcock International operates in the infrastructure sector, generated only £50 million in revenue for FY 2022, down from £70 million in FY 2021. This equates to a significant year-over-year decline of 28.6%. The market share in this region remains below 15%, resulting in a strategic reevaluation of investment in this market.
Underperforming Joint Ventures
Babcock International's joint ventures have also underperformed, particularly in the aerospace sector. The joint venture with Airbus, aimed at providing maintenance services, has yielded revenues of only £120 million, with an operating loss of approximately £10 million in FY 2022. This underperformance highlights a market share of approximately 10% in a rapidly consolidating market where competitors claim significantly higher stakes.
| Segment | Revenue FY 2022 (£ Million) | Revenue FY 2023 (£ Million) | Year-over-Year Change (%) | Market Share (%) | Operating Margin (%) |
|---|---|---|---|---|---|
| Legacy Manufacturing Operations | £315 | £300 | -5 | N/A | 3.5 |
| South African Market | £70 | £50 | -28.6 | 15 | N/A |
| Aerospace Joint Venture with Airbus | £130 | £120 | -7.7 | 10 | -8.3 |
In summary, the legacy manufacturing operations, low-demand geographic markets, and underperforming joint ventures of Babcock International Group PLC are considered 'Dogs' within the BCG Matrix. The low market share and growth rates indicate they are cash traps that require significant resources, yet do not provide a reasonable return on investment.
Babcock International Group PLC - BCG Matrix: Question Marks
The segment of Question Marks within Babcock International Group PLC's portfolio refers to products or services that exist in high-growth markets but currently possess low market share. This position signifies both challenge and opportunity, where substantial investment can enhance market presence or prompt a decision to divest.
Emerging Technology Solutions
Babcock has made moves towards innovative technology solutions, including digital transformation services. The global market for digital transformation was valued at approximately USD 1.3 trillion in 2020 and is projected to reach USD 2.3 trillion by 2025, growing at a compound annual growth rate (CAGR) of 12%.
| Year | Market Value (USD) | CAGR (%) |
|---|---|---|
| 2020 | 1.3 trillion | N/A |
| 2025 (Projected) | 2.3 trillion | 12% |
Despite the growth potential, Babcock's current market share in this sector remains low, reflecting the need for strategic marketing and investment to capture demand. In 2022, Babcock reported approximately GBP 350 million in revenue related to emerging technologies, indicating a relatively nascent position within this expanding market.
Autonomous Systems Development
The sector of autonomous systems offers significant growth opportunities, particularly in defense and transportation. As per reports, the global autonomous systems market was valued at around USD 24.1 billion in 2020 and is expected to grow to USD 94.3 billion by 2026, achieving a CAGR of 27.1%.
| Year | Market Value (USD) | CAGR (%) |
|---|---|---|
| 2020 | 24.1 billion | N/A |
| 2026 (Projected) | 94.3 billion | 27.1% |
In the fiscal year 2021, Babcock's investment in autonomous systems was roughly GBP 50 million, a figure that underscores their commitment to emerging as a key player. However, the company’s overall market share in this domain is still significantly below competitors, necessitating increased focus and resource allocation.
New Market Entries
Babcock has ventured into several new geographical markets aiming to diversify its portfolio and tap into fresh opportunities. The international defense market is expected to grow from USD 600 billion in 2021 to approximately USD 700 billion by 2026, indicating a healthy growth trajectory. Nevertheless, Babcock’s current share of this market is estimated at only around 2%, reflecting the challenges posed by intense competition and the need for strategic investments.
| Year | Market Value (USD) | Babcock’s Market Share (%) |
|---|---|---|
| 2021 | 600 billion | 2% |
| 2026 (Projected) | 700 billion | 2.5% (target) |
In 2022, the organization allocated approximately GBP 100 million to penetrate these new markets. Achieving a significant increase in market share will depend on strategic marketing and efficient execution of their operational capabilities.
In analyzing Babcock International Group PLC through the lens of the BCG Matrix, it becomes evident that the company's strategic positioning encompasses a diverse portfolio, from robust Stars like Defense Contracts to promising Question Marks in emerging technologies. This dynamic illustrates both the strengths and challenges facing the organization, providing a roadmap for investors and analysts to navigate the complexities of its future growth and operational focus.
[right_small]Disclaimer
All information, articles, and product details provided on this website are for general informational and educational purposes only. We do not claim any ownership over, nor do we intend to infringe upon, any trademarks, copyrights, logos, brand names, or other intellectual property mentioned or depicted on this site. Such intellectual property remains the property of its respective owners, and any references here are made solely for identification or informational purposes, without implying any affiliation, endorsement, or partnership.
We make no representations or warranties, express or implied, regarding the accuracy, completeness, or suitability of any content or products presented. Nothing on this website should be construed as legal, tax, investment, financial, medical, or other professional advice. In addition, no part of this site—including articles or product references—constitutes a solicitation, recommendation, endorsement, advertisement, or offer to buy or sell any securities, franchises, or other financial instruments, particularly in jurisdictions where such activity would be unlawful.
All content is of a general nature and may not address the specific circumstances of any individual or entity. It is not a substitute for professional advice or services. Any actions you take based on the information provided here are strictly at your own risk. You accept full responsibility for any decisions or outcomes arising from your use of this website and agree to release us from any liability in connection with your use of, or reliance upon, the content or products found herein.