
|
Bank of America Corporation (BAC): 5 FORCES Analysis [Nov-2025 Updated] |
Fully Editable: Tailor To Your Needs In Excel Or Sheets
Professional Design: Trusted, Industry-Standard Templates
Investor-Approved Valuation Models
MAC/PC Compatible, Fully Unlocked
No Expertise Is Needed; Easy To Follow
Bank of America Corporation (BAC) Bundle
You're looking for a clear-eyed view of Bank of America Corporation's (BAC) competitive standing as we head into late 2025, and honestly, the landscape is a tug-of-war. With assets hitting about $\mathbf{\$3.27 \text{ trillion}}$ and its Global Wealth & Investment Management division managing $\mathbf{\$3.5 \text{ trillion}}$, BAC has massive scale, but that doesn't mean it's coasting; after all, $\mathbf{1 \text{ in } 4}$ households are thinking about switching banks, and rivalry with the Big Four is fierce, even as investment banking fees jumped $\mathbf{43\%}$ last quarter to $\mathbf{\$2 \text{ billion}}$. To truly understand where the profit pressure is coming from-whether it's demanding corporate clients, high-cost tech suppliers with switching costs exceeding $\mathbf{\$100 \text{ million}}$, or nimble fintech substitutes-we need to map out Michael Porter's five forces shaping BAC's profitability right now, so let's dive into the details below.
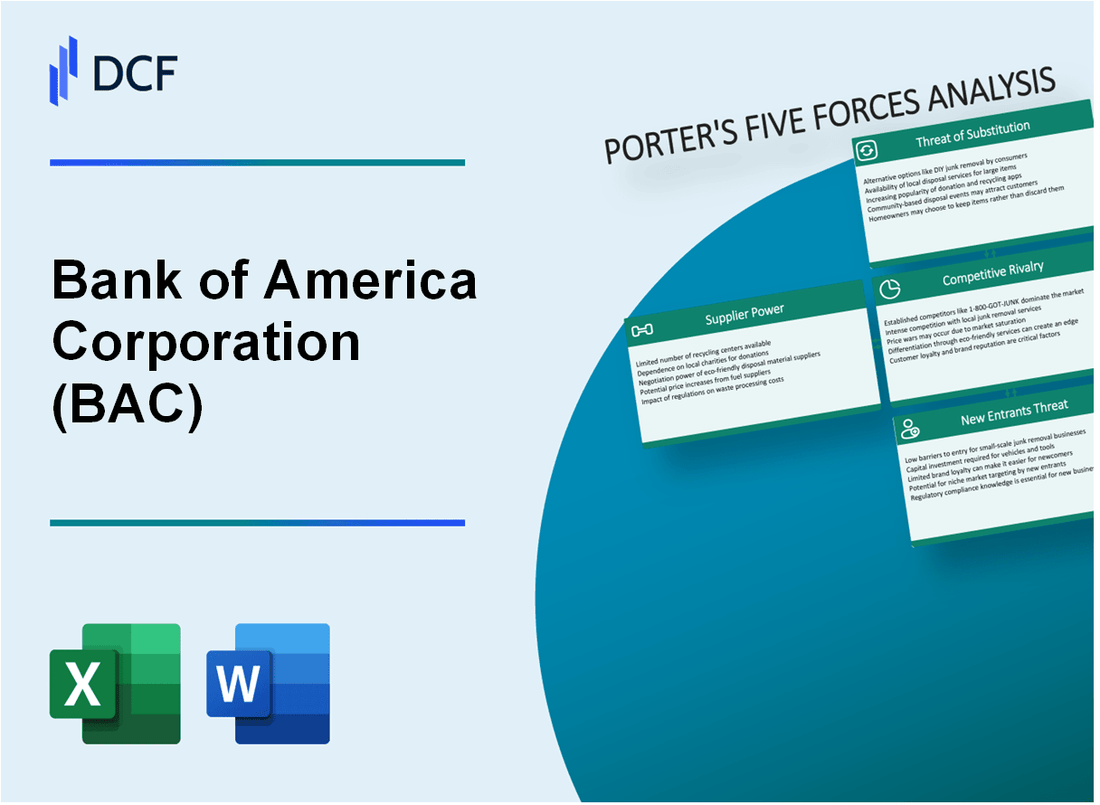
Bank of America Corporation (BAC) - Porter's Five Forces: Bargaining power of suppliers
When we look at Bank of America Corporation's suppliers, we're really talking about two main groups: the technology providers that run the engine room, and the depositors who supply the raw material-capital. The power dynamic shifts dramatically between these two groups.
Concentration of core banking technology vendors increases their leverage. You know, the big players in the core systems space-the ones that handle everything from ledgers to compliance-are few. If you're Bank of America Corporation, you can't just swap out your entire operational backbone on a whim. This lack of alternatives gives the dominant vendors significant negotiating muscle, especially when it comes to service level agreements and pricing renewals.
High switching costs for major systems can exceed $100 million, boosting vendor power. Honestly, for a firm the size of Bank of America Corporation, the capital expenditure (CAPEX) to rip out and replace a core system is massive, likely much higher than that benchmark, which is often cited as an average for a mid-sized institution. The true cost involves not just the software license, but the integration, data migration, and the sheer operational risk. This financial and operational inertia locks the bank in, making the supplier's position quite strong.
Depositors, as capital suppliers, have low individual power due to Bank of America's scale. Think about it: Bank of America Corporation has a massive consumer deposit base, reported at around $949 billion spread across approximately 69 million customers as of mid-2025. Individually, your $5,000 savings account doesn't give you much leverage. The bank exercises its market power by paying depositors less interest, which is a key driver of profitability. Those cheap deposits are gold; they drive about 55 percent of the company's revenue, translating to roughly $60.4 billion in net interest income this year.
Labor market competition for specialized tech talent drives up compensation costs. This is where the supplier power is felt in the operating expenses. Bank of America Corporation is spending heavily to keep pace digitally, allocating $4 billion toward AI and new tech initiatives in 2025, which is nearly a third of its total $12 billion annual technology budget. To staff those initiatives, they compete fiercely for engineers. For instance, the average total compensation for a Tech employee at Bank of America Corporation in 2025 hovers around $131k, with Software Engineers seeing a median total compensation near $125,000. When top tech talent can command salaries in the $160k+ range, the pressure on Bank of America Corporation's compensation structure is real, effectively raising the cost of this critical input.
Here's a quick look at how these supplier costs stack up:
| Supplier Input Category | Relevant Metric/Amount (2025 Data) | Impact on BAC |
|---|---|---|
| Technology Vendors (Core Systems) | Switching Cost Benchmark: $100 million+ | High lock-in, strong vendor leverage on pricing. |
| Technology Vendors (Annual Spend) | Total Annual Technology Spend: $12 billion | Large, non-negotiable operating expense. |
| Capital Suppliers (Depositors) | Total Deposits: $949 billion | Low individual power, high collective value to NII ($60.4 billion). |
| Labor (Specialized Tech Talent) | Average Tech Total Compensation: $131k | Directly inflates noninterest expense due to market competition. |
The dynamic is clear: Bank of America Corporation has immense power over its capital suppliers (depositors) but faces significant, concentrated power from its technology providers and the competitive labor market for the talent needed to run those systems. Finance: draft 13-week cash view by Friday.
Bank of America Corporation (BAC) - Porter's Five Forces: Bargaining power of customers
You're analyzing Bank of America Corporation's customer power, and honestly, it's a tale of two segments. For the everyday consumer, power is diffuse, but the sheer scale of the client base means even small shifts matter. For the top-tier clients, the power to negotiate terms is defintely much higher.
Individual customers have low power, but data suggests a significant portion is at least considering alternatives; for instance, 1 in 4 households consider switching banks. This latent threat keeps Bank of America focused on service quality. To be fair, the bank serves nearly 70 million consumer and small business clients in total.
Large corporate and High-Net-Worth clients negotiate aggressively. The Global Wealth and Investment Management (GWIM) segment manages massive pools of capital, which gives them leverage. For context, Merrill Wealth Management reported client balances of $3.5 trillion in the first quarter of 2025. By the third quarter of 2025, core wealth operations managed $4.6 trillion in client assets.
Bank of America pays significantly lower interest on deposits, leveraging its market power over its massive retail base. While market rates fluctuate, Bank of America's 3 Month Flexible CD was recently noted with an Annual Percentage Yield (APY) of 0.10%. This low cost of funds is a direct benefit of their scale, as their consumer deposit base stands at $949 billion.
Digital users, at approximately 59 million verified digital users as of late 2025, demand seamless, low-cost services. This massive digital footprint means customer experience in the app or online is a primary battleground for retention.
Here's a quick look at the scale across key customer groups:
| Customer Segment | Metric Type | Amount/Value |
| Retail/Consumer Base | Total Consumer & Small Business Clients | Nearly 70 million |
| Retail Deposits | Total Consumer Deposits | $949 billion |
| Digital Users | Verified Digital Users (Latest Data) | 59 million |
| HNW/Corporate Clients | Merrill Wealth Client Balances (Q1 2025) | $3.5 trillion |
| HNW/Corporate Clients | Core Wealth Client Balances (Q3 2025) | $4.6 trillion |
The power dynamic is further shaped by the digital experience and the competitive landscape:
- Digital sales accounted for a record 55% of total sales in 2024.
- The bank's AI assistant, Erica, saw 676 million interactions in 2024 alone.
- The Consumer Financial Protection Bureau rule, set to take effect in April 2026 for large companies, is designed to make switching easier.
- Bank of America's technology spend is $13 billion annually, with nearly $4 billion allocated to new initiatives in 2025.
Finance: draft 13-week cash view by Friday.
Bank of America Corporation (BAC) - Porter's Five Forces: Competitive rivalry
You're looking at the competitive landscape for Bank of America Corporation (BAC) as of late 2025, and honestly, the rivalry among the top tier is as sharp as ever. Pricing pressure is a constant, especially in core lending and deposit gathering, even as capital markets activity heats up.
Here's a look at how the Big Four stacked up in the third quarter of 2025, which really shows where the competitive heat is being applied:
| Metric (Q3 2025) | Bank of America Corporation (BAC) | JPMorgan Chase (JPM) | Citigroup (C) | Wells Fargo (WFC) |
|---|---|---|---|---|
| Total Revenue (Net of Interest Expense) | $28.24 billion | $47.1 billion | $22.09 billion | $21.44 billion |
| Net Interest Income (NII) | $15.2 billion | $24.1 billion | (Not explicitly stated) | (Not explicitly stated) |
| Diluted EPS (Reported) | $1.06 | $5.07 | (Adjusted EPS: $2.24) | $1.66 |
Competition for investment banking fees is fierce, but the market is clearly expanding. Bank of America Corporation saw its Q3 2025 fees rise 43% year-over-year to $2 billion. That rebound in deal-making is shared across the sector, though some peers posted higher figures:
- Goldman Sachs (GS) Q3 2025 Investment Banking Fees: $2.66 billion
- JPMorgan Chase (JPM) Q3 2025 Investment Banking Fees: $2.6 billion
- Bank of America Corporation Q3 2025 Investment Banking Fees: $2 billion
Globally, dealmaking topped $3 trillion in the first nine months of 2025. Bank of America Corporation maintained its #3 investment banking fee ranking year-to-date.
The bank's sheer scale keeps it a top-tier competitor. Total assets were reported around $3.26 trillion at the end of 2024, with Q1 2025 total assets reaching $3.35 trillion. This massive balance sheet supports aggressive positioning in the market.
The persistent low interest rate environment forces aggressive competition for loan volume and deposits, even as net interest income (NII) grows. Bank of America Corporation's Q3 2025 NII was $15.2 billion, an increase of 9% year-over-year. Still, management noted that the impact of lower interest rates partially offset that NII growth. To counter this, the bank pushed for volume:
- Average Loan and Lease Balance (Q3 2025): $1.15 trillion (up 9% Y/Y)
- Average Deposits (Q3 2025): $1.99 trillion (up 4% Y/Y)
The bank is projecting its NII momentum to continue, guiding Q4 2025 NII between $15.6 billion and $15.7 billion.
Bank of America Corporation (BAC) - Porter's Five Forces: Threat of substitutes
Fintechs and non-bank lenders offer specialized products like Buy Now, Pay Later (BNPL).
The US Buy Now Pay Later Services Market was valued at $170.32 billion in 2025. Globally, the BNPL market is forecast to reach $560.1 billion in 2025. Banks have reportedly lost between $8 billion and $10 billion in annual revenue to BNPL providers. Affirm reported 21.9 million users in early 2025. In 2025, 46% of Gen Z consumers used a BNPL option. PayPal processed over $33 billion in global BNPL volume in 2024.
| Metric | BNPL/Fintech Data (2025) | Traditional Bank Comparison Point |
| US Market Value | $170.32 billion (2025) | N/A |
| Global Market Value | $560.1 billion (2025) | N/A |
| Affirm Users | 21.9 million (Early 2025) | N/A |
| Gen Z Usage | 46% used BNPL in 2025 | N/A |
Digital wallets and payment platforms bypass traditional bank transaction fees.
- Digital wallets are expected to account for 50% of global e-commerce transaction value in 2025.
- US digital payment transaction value is projected to hit $3.15 trillion in 2025.
- By mid-2025, 65% of US adults were using a digital wallet.
- 55% of US consumers preferred digital wallets for cross-border payments in early 2025.
- Mobile payments surpassed cash, debit, and traditional credit cards for in-store purchases in the US for the first time in 2024.
Robo-advisors and low-cost brokerages substitute for wealth management services.
| Service Type | Typical Annual Fee (% of AUM) |
| Traditional Financial Advisors | 0.8% to 1.2% or 0.75% to 1.50% |
| Robo-Advisors (Basic) | 0.25% to 0.50% |
| Merrill Guided Investing (Tiered) | 0.45% or 0.85% |
Robo-advisor assets were between $634 billion and $754 billion in 2024. Still, 70% of investors prefer advice from a human advisor.
Cryptocurrency and prediction markets pose an emerging credit risk, especially to younger consumers.
- A Bank of America survey noted over 75% of US investors have no crypto exposure.
- As of July 2025, stablecoins facilitated around $30 billion of transactions daily.
- Bitcoin and Ethereum dropped 5.3% and 6.9% respectively in a single day in October 2025 due to indirect risk transmission.
- Roughly 67% of fund managers have not considered crypto worthy of allocation.
Bank of America Corporation (BAC) - Porter's Five Forces: Threat of new entrants
You're looking at the barriers to entry for a new player trying to take on Bank of America Corporation. Honestly, the deck is stacked heavily against them, primarily due to regulation and the sheer scale of capital needed.
- Regulatory hurdles are a massive barrier, requiring complex compliance and oversight.
- High capital requirements are prohibitive; large banks must meet a 13% minimum under Basel III.
- New digital banks (neobanks) have lower overhead but lack Bank of America Corporation's trust and deposit base.
- Establishing brand credibility and a national branch/ATM network is immensely costly.
The regulatory moat is deep. For instance, Bank of America, N.A. reported a Common Equity Tier 1 capital ratio of 13.4% as of March 31, 2025, under the Standardized approach, which is already above the general Basel III minimum of 13% that large institutions must maintain to avoid restrictions on capital distributions. A new entrant faces this same baseline requirement, plus the stress capital buffer and any G-SIB surcharge if they scale significantly.
Here's a quick look at the capital position for Bank of America Corporation as of Q1 2025, showing the buffer they already maintain:
| Capital Ratio Type (as of March 31, 2025) | Bank of America Corporation | Regulatory Minimum (Basel III Reference) |
| Common Equity Tier 1 Capital Ratio (Standardized) | 13.4% | N/A (General reference is 13%) |
| Tier 1 Capital Ratio (Standardized) | 13.4% | N/A |
| Total Capital Ratio (Standardized) | 14.5% | N/A |
| Tier 1 Leverage Ratio | 7.6% | N/A |
Now, consider the digital challengers. While neobanks are scaling fast-the global neobanking market is estimated at $230.55 billion in 2025-they are still building the trust Bank of America Corporation has cemented over decades. In the U.S., digital banking users are expected to hit 216.8 million in 2025, but the established stability and broader service suite of a firm like Bank of America Corporation remain key differentiators for complex needs. For context, Nubank, a major neobank, boasts over 100 million users across just three Latin American countries, a customer base that surpasses Bank of America Corporation's in those specific regions. Still, that trust factor is huge; traditional banks are heavily regulated and FDIC insured, offering a sense of security that many customers won't trade for lower fees alone.
The physical footprint is another massive hurdle. You can't just launch a national competitor overnight. Look at what a major peer is doing: PNC Bank announced an approximate $1 billion investment through 2028 to open more than 100 new locations and renovate over 1,200 existing branches. That kind of capital outlay just to maintain and expand a current network shows you the prohibitive cost for a brand-new entrant to even attempt to match Bank of America Corporation's existing scale of physical access points and ATMs across the country.
The barriers to entry are quantifiable:
- Minimum CET1 requirement: 13%.
- PNC's recent physical network investment: nearly $1 billion.
- U.S. digital banking users (2025 estimate): 216.8 million.
- Bank of America Corporation's Q1 2025 Tier 1 Capital Ratio: 13.4%.
Disclaimer
All information, articles, and product details provided on this website are for general informational and educational purposes only. We do not claim any ownership over, nor do we intend to infringe upon, any trademarks, copyrights, logos, brand names, or other intellectual property mentioned or depicted on this site. Such intellectual property remains the property of its respective owners, and any references here are made solely for identification or informational purposes, without implying any affiliation, endorsement, or partnership.
We make no representations or warranties, express or implied, regarding the accuracy, completeness, or suitability of any content or products presented. Nothing on this website should be construed as legal, tax, investment, financial, medical, or other professional advice. In addition, no part of this site—including articles or product references—constitutes a solicitation, recommendation, endorsement, advertisement, or offer to buy or sell any securities, franchises, or other financial instruments, particularly in jurisdictions where such activity would be unlawful.
All content is of a general nature and may not address the specific circumstances of any individual or entity. It is not a substitute for professional advice or services. Any actions you take based on the information provided here are strictly at your own risk. You accept full responsibility for any decisions or outcomes arising from your use of this website and agree to release us from any liability in connection with your use of, or reliance upon, the content or products found herein.