
|
Barings BDC, Inc. (BBDC) DCF Valuation |
Fully Editable: Tailor To Your Needs In Excel Or Sheets
Professional Design: Trusted, Industry-Standard Templates
Investor-Approved Valuation Models
MAC/PC Compatible, Fully Unlocked
No Expertise Is Needed; Easy To Follow
Barings BDC, Inc. (BBDC) Bundle
Evaluate Barings BDC, Inc.'s (BBDC) financial prospects like an expert! This (BBDC) DCF Calculator comes with pre-filled financial data and offers full flexibility to modify revenue growth, WACC, margins, and other essential assumptions to align with your predictions.
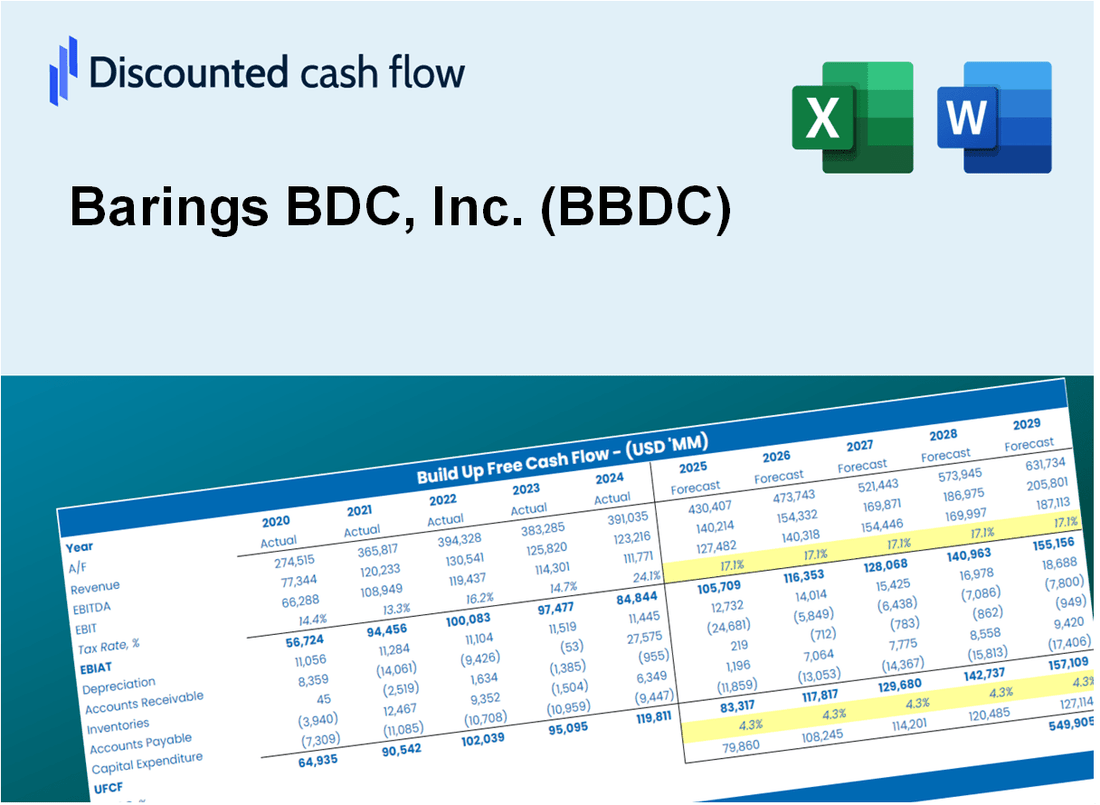
Discounted Cash Flow (DCF) - (USD MM)
| Year | AY1 2020 |
AY2 2021 |
AY3 2022 |
AY4 2023 |
AY5 2024 |
FY1 2025 |
FY2 2026 |
FY3 2027 |
FY4 2028 |
FY5 2029 |
|---|---|---|---|---|---|---|---|---|---|---|
| Revenue | 37.0 | 119.8 | 219.1 | 289.2 | 209.1 | 307.0 | 450.6 | 661.5 | 971.0 | 1,425.5 |
| Revenue Growth, % | 0 | 224.03 | 82.91 | 31.98 | -27.7 | 46.8 | 46.8 | 46.8 | 46.8 | 46.8 |
| EBITDA | 8.2 | 77.7 | 173.1 | 214.5 | 113.8 | 180.9 | 265.6 | 389.9 | 572.3 | 840.2 |
| EBITDA, % | 22.26 | 64.85 | 79.01 | 74.18 | 54.4 | 58.94 | 58.94 | 58.94 | 58.94 | 58.94 |
| Depreciation | .0 | .0 | .0 | .0 | .0 | .0 | .0 | .0 | .0 | .0 |
| Depreciation, % | 0 | 0 | 0 | 0 | 0 | 0 | 0 | 0 | 0 | 0 |
| EBIT | 8.2 | 77.7 | 173.1 | 214.5 | 113.8 | 180.9 | 265.6 | 389.9 | 572.3 | 840.2 |
| EBIT, % | 22.26 | 64.85 | 79.01 | 74.18 | 54.4 | 58.94 | 58.94 | 58.94 | 58.94 | 58.94 |
| Total Cash | 89.0 | 84.3 | 139.4 | 70.5 | 77.8 | 181.5 | 266.4 | 391.0 | 574.0 | 842.6 |
| Total Cash, percent | .0 | .0 | .0 | .0 | .0 | .0 | .0 | .0 | .0 | .0 |
| Account Receivables | 69.0 | 253.4 | 62.7 | 52.9 | 56.3 | 168.1 | 246.8 | 362.3 | 531.8 | 780.7 |
| Account Receivables, % | 186.7 | 211.5 | 28.62 | 18.29 | 26.94 | 54.77 | 54.77 | 54.77 | 54.77 | 54.77 |
| Inventories | .0 | .0 | .0 | .0 | .0 | .0 | .0 | .0 | .0 | .0 |
| Inventories, % | 0 | 0 | 0 | 0 | 0 | 0 | 0 | 0 | 0 | 0 |
| Accounts Payable | 9.8 | 34.8 | 44.2 | 12.5 | 29.2 | 57.7 | 84.8 | 124.4 | 182.7 | 268.2 |
| Accounts Payable, % | 26.54 | 29.07 | 20.16 | 4.33 | 13.96 | 18.81 | 18.81 | 18.81 | 18.81 | 18.81 |
| Capital Expenditure | .0 | .0 | .0 | .0 | .0 | .0 | .0 | .0 | .0 | .0 |
| Capital Expenditure, % | 0 | 0 | 0 | 0 | 0 | 0 | 0 | 0 | 0 | 0 |
| Tax Rate, % | 3.05 | 3.05 | 3.05 | 3.05 | 3.05 | 3.05 | 3.05 | 3.05 | 3.05 | 3.05 |
| EBITAT | 8.2 | 77.7 | 133.1 | 211.7 | 110.3 | 170.8 | 250.7 | 368.0 | 540.2 | 793.0 |
| Depreciation | ||||||||||
| Changes in Account Receivables | ||||||||||
| Changes in Inventories | ||||||||||
| Changes in Accounts Payable | ||||||||||
| Capital Expenditure | ||||||||||
| UFCF | -51.0 | -81.6 | 333.1 | 189.9 | 123.5 | 87.5 | 199.0 | 292.1 | 428.9 | 629.6 |
| WACC, % | 6.28 | 6.3 | 5.48 | 6.26 | 6.2 | 6.1 | 6.1 | 6.1 | 6.1 | 6.1 |
| PV UFCF | ||||||||||
| SUM PV UFCF | 1,310.4 | |||||||||
| Long Term Growth Rate, % | 2.00 | |||||||||
| Free cash flow (T + 1) | 642 | |||||||||
| Terminal Value | 15,648 | |||||||||
| Present Terminal Value | 11,636 | |||||||||
| Enterprise Value | 12,947 | |||||||||
| Net Debt | 1,373 | |||||||||
| Equity Value | 11,574 | |||||||||
| Diluted Shares Outstanding, MM | 106 | |||||||||
| Equity Value Per Share | 109.48 |
What You Will Get
- Editable Forecast Inputs: Easily modify assumptions (growth %, margins, WACC) to generate various scenarios.
- Real-World Data: Barings BDC, Inc. (BBDC) financial data pre-filled to kickstart your analysis.
- Automatic DCF Outputs: The template computes Net Present Value (NPV) and intrinsic value for you.
- Customizable and Professional: A refined Excel model that adjusts to your valuation requirements.
- Built for Analysts and Investors: Perfect for testing projections, validating strategies, and enhancing efficiency.
Key Features
- Comprehensive DCF Calculator: Offers detailed unlevered and levered DCF valuation models tailored for Barings BDC, Inc. (BBDC).
- WACC Calculator: Features a pre-built Weighted Average Cost of Capital sheet with adjustable inputs specific to Barings BDC, Inc. (BBDC).
- Customizable Forecast Assumptions: Easily modify growth rates, capital expenditures, and discount rates relevant to Barings BDC, Inc. (BBDC).
- Integrated Financial Ratios: Evaluate profitability, leverage, and efficiency ratios specifically for Barings BDC, Inc. (BBDC).
- Interactive Dashboard and Charts: Visual representations that summarize key valuation metrics for straightforward analysis of Barings BDC, Inc. (BBDC).
How It Works
- 1. Access the Model: Download and open the Excel template featuring Barings BDC, Inc. (BBDC) data.
- 2. Adjust Key Inputs: Modify essential parameters such as growth rates, WACC, and capital expenditures.
- 3. Analyze Results Immediately: The DCF model automatically computes intrinsic value and NPV in real-time.
- 4. Explore Different Scenarios: Evaluate various forecasts to assess potential valuation results.
- 5. Present with Assurance: Deliver expert valuation analyses to bolster your investment decisions.
Why Choose Barings BDC, Inc. (BBDC) Calculator?
- All-in-One Solution: Combines DCF, WACC, and financial ratio analyses for comprehensive evaluations.
- Flexible Inputs: Modify the highlighted cells to explore different financial scenarios.
- In-Depth Analysis: Automatically computes Barings BDC's intrinsic value and Net Present Value.
- Preloaded Information: Access to historical and projected data for reliable analysis.
- High-Quality Standards: Perfect for financial analysts, investors, and business consultants.
Who Should Use Barings BDC, Inc. (BBDC)?
- Finance Students: Explore investment strategies and gain practical experience with real-world data.
- Academics: Integrate industry-specific models into your teaching or research projects.
- Investors: Evaluate your investment hypotheses and examine performance metrics for Barings BDC, Inc. (BBDC).
- Analysts: Enhance your analysis with a ready-to-use, adaptable financial model.
- Small Business Owners: Learn from the evaluation methods used for public companies like Barings BDC, Inc. (BBDC).
What the Template Contains
- Operating and Balance Sheet Data: Pre-filled Barings BDC, Inc. (BBDC) historical data and forecasts, including revenue, EBITDA, EBIT, and capital expenditures.
- WACC Calculation: A dedicated sheet for Weighted Average Cost of Capital (WACC), featuring parameters like Beta, risk-free rate, and share price.
- DCF Valuation (Unlevered and Levered): Editable Discounted Cash Flow models displaying intrinsic value with detailed calculations.
- Financial Statements: Pre-loaded financial statements (annual and quarterly) to support comprehensive analysis.
- Key Ratios: Includes profitability, leverage, and efficiency ratios for Barings BDC, Inc. (BBDC).
- Dashboard and Charts: Visual summary of valuation outputs and assumptions for easy result analysis.
Disclaimer
All information, articles, and product details provided on this website are for general informational and educational purposes only. We do not claim any ownership over, nor do we intend to infringe upon, any trademarks, copyrights, logos, brand names, or other intellectual property mentioned or depicted on this site. Such intellectual property remains the property of its respective owners, and any references here are made solely for identification or informational purposes, without implying any affiliation, endorsement, or partnership.
We make no representations or warranties, express or implied, regarding the accuracy, completeness, or suitability of any content or products presented. Nothing on this website should be construed as legal, tax, investment, financial, medical, or other professional advice. In addition, no part of this site—including articles or product references—constitutes a solicitation, recommendation, endorsement, advertisement, or offer to buy or sell any securities, franchises, or other financial instruments, particularly in jurisdictions where such activity would be unlawful.
All content is of a general nature and may not address the specific circumstances of any individual or entity. It is not a substitute for professional advice or services. Any actions you take based on the information provided here are strictly at your own risk. You accept full responsibility for any decisions or outcomes arising from your use of this website and agree to release us from any liability in connection with your use of, or reliance upon, the content or products found herein.