
|
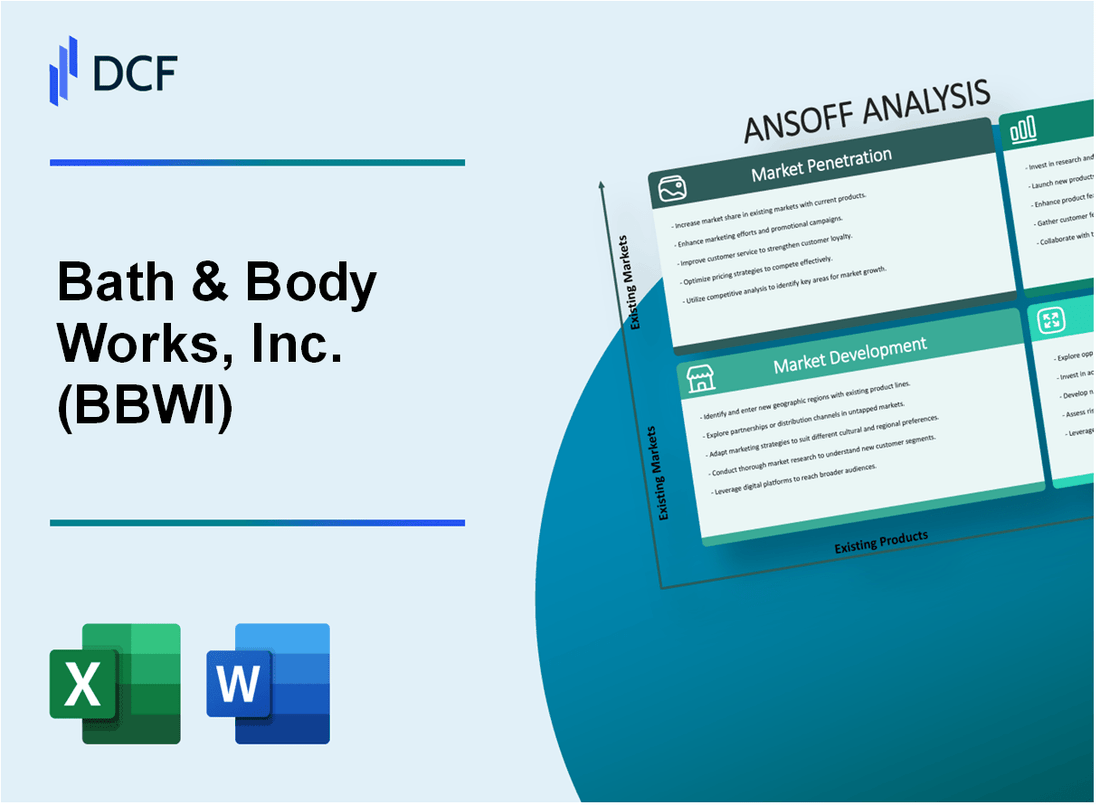
Bath & Body Works, Inc. (BBWI): ANSOFF MATRIX [Dec-2025 Updated] |
Fully Editable: Tailor To Your Needs In Excel Or Sheets
Professional Design: Trusted, Industry-Standard Templates
Investor-Approved Valuation Models
MAC/PC Compatible, Fully Unlocked
No Expertise Is Needed; Easy To Follow
Bath & Body Works, Inc. (BBWI) Bundle
You're looking at a tough retail landscape right now, and frankly, figuring out where Bath & Body Works, Inc. (BBWI) places its next big bet is critical. After two decades analyzing companies, including my time leading analysts at BlackRock, I've mapped out their clearest growth avenues using the Ansoff Matrix, translating near-term risks into concrete actions. We see them pushing for 6.1% international sales growth while simultaneously refining promotions to protect brand equity-it's a balanced approach. Below, you'll find the four distinct paths-from doubling down in existing stores to exploring entirely new ventures like subscription boxes-that will define their next chapter. Dive in to see the specific, actionable strategies we've laid out for the coming fiscal year.
Bath & Body Works, Inc. (BBWI) - Ansoff Matrix: Market Penetration
The current operational footprint for Bath & Body Works, Inc. includes 2,478 stores at the end of the third quarter of 2025. This is part of a base that operates over 1,900 stores in the U.S. and Canada.
The loyalty program remains a core driver for existing customer sales. In the third quarter of 2024, active members of the loyalty program reached approximately 38 million, a 4% increase from the prior quarter. More than 80% of U.S. sales in that period originated from program members.
The company is actively managing its physical footprint. The total number of locations at the end of Q3 2025 was 2,478.
Digital channel improvements center on lowering the barrier to online purchase. The current e-commerce free shipping threshold is $100. Standard shipping for online orders is $6.99 for orders above $10. The plan is to implement a permanently lower free shipping threshold in early 2026.
Financial discipline is being used to fund brand investment. Bath & Body Works, Inc. is targeting $250 million in cost savings over two years. Over half of these savings are identified for 2026. These savings will be used to invest in revenue-generating initiatives across product and brand.
Refining the promotional strategy is linked to recent financial performance, which reflects promotional intensity. Third quarter 2025 adjusted earnings per diluted share was $0.35, compared to $0.49 in the third quarter of 2024. Third quarter 2025 net sales were $1.59 billion, a 1% decrease year-over-year. Fiscal 2024 revenue was $7,307 million. The full-year 2025 net sales guidance is now a decline of low single digits against fiscal 2024 revenue.
Here are key operational and financial metrics from recent reporting periods:
| Metric | Value (Most Recent Period) | Period Reference |
| Total Stores (End of Q3) | 2,478 | Q3 2025 |
| Loyalty Active Members | 38 million | Q3 2024 |
| Current Free Shipping Threshold | $100 | Current |
| Total Cost Savings Target | $250 million | Over two years |
| Q3 2025 Net Sales | $1.59 billion | Q3 2025 |
| Q3 2025 Adjusted EPS | $0.35 | Q3 2025 |
| Q3 2024 Adjusted EPS | $0.49 | Q3 2024 |
The company is also planning a launch on Amazon in the first half of 2026.
The company is focused on creator-led brand advocacy as part of its strategy to reignite the brand.
The company is exiting the hair and men's grooming categories.
Bath & Body Works, Inc. (BBWI) - Ansoff Matrix: Market Development
You're looking at how Bath & Body Works, Inc. plans to take its existing products into new geographic areas or new distribution channels. This Market Development quadrant is all about finding new customers for what you already make well.
The international franchise strategy is set to push past the current footprint. As of October 2025, Bath & Body Works, Inc. has more than 530 international locations across six continents and over 40 countries. This asset-light franchise model is key for entering new territories, replicating successes like the flagship store debut on London's iconic Oxford Street in 2025. The company has a history of European entry, starting in Italy in the 2015-2016 timeframe. More recently, a franchisee secured the exclusive right to open an online store and 20 physical stores in Germany over the next four years, with the first five stores planned within 15 months of the February 2025 agreement.
Domestically, the focus is on new channels to reach the Gen Z consumer. The company is executing a wholesale expansion into college campus bookstores, partnering to reach approximately 600 U.S. college campuses. This includes exclusive "Shop in Shop" installations at 50 of those participating campus stores, offering an expansive assortment of fine fragrance mists, body lotions, and hand soaps.
The third quarter of fiscal 2025 showed the necessity of this international push. International net sales grew by 6.1% to reach $73 million, representing 4% of total revenue. This growth helped offset the decline in the Direct - U.S. and Canada channel, which saw net sales tumble by 7.0% to $299 million. To be fair, U.S. and Canadian store sales were relatively flat, inching up just 0.2% to $1.22 billion.
A major digital market development is the planned launch on Amazon in the first half of 2026. Management estimates that the company is currently losing between $60 million and $80 million in brand-dilutive gray market sales on that platform. The official launch will start with a small assortment of evergreen products to test and learn.
Here's a quick look at the Q3 2025 channel performance that drives this strategy:
| Channel | Q3 2025 Net Sales (Millions USD) | Year-over-Year Change |
| Stores - U.S. and Canada | $1,220 | +0.2% |
| Direct - U.S. and Canada | $299 | -7.0% |
| International | $73 | +6.1% |
The company is also targeting $250 million in cost savings over the next two years, with over half identified for 2026, to fund these revenue-generating initiatives.
The key components of this Market Development are:
- Expanding international franchise footprint beyond the current over 530 locations.
- Executing the planned launch of core products on Amazon in H1 2026.
- Capturing estimated $60-$80 million in current gray market sales.
- Replicating the 2025 Oxford Street flagship success in new European or South American countries.
- Establishing wholesale relationships like the 600+ campus bookstore expansion.
- Growing international sales, which rose 6.1% in Q3 2025, to offset the domestic direct sales decline of 7.0%.
Finance: draft the 2026 capital allocation plan for international expansion by Friday.
Bath & Body Works, Inc. (BBWI) - Ansoff Matrix: Product Development
You're looking at the core of Bath & Body Works, Inc.'s (BBWI) near-term strategy: doubling down on what works while streamlining the portfolio. This is the Product Development quadrant in action, focusing innovation on existing markets with new offerings. The new vision, called the Consumer First Formula, makes this clear.
The first action is a deliberate simplification. Bath & Body Works, Inc. is focusing investment behind its four largest revenue-driving opportunities, which are its core categories: body care, home fragrance, and soaps and sanitizers. To fund this focus, the company is actively simplifying the assortment by exiting lines that aren't core, specifically mentioning the exit from the hair and men's grooming categories. This disciplined approach follows a period where revenue segments outside the core saw varying and limited success.
The 'Everyday Luxuries' collection, introduced in 2024 as a prestige-inspired line of fine fragrance mists, is a key growth driver that you need to watch. This collection saw continued strength, leading the brand to expand the assortment to new forms, including body wash and body cream, during the first quarter of 2025. This expansion into new forms within a successful line is a direct product development play.
Here's a look at how the core categories performed recently, showing where the focus is being reapplied:
| Category | Q1 2025 Performance | Q2 2025 Performance |
| Soaps and Sanitizers | Grew mid-single digits | Showed strong high-single digit growth |
| Home Fragrance | Grew low single digits | Grew at low-single digits |
| Body Care | Not specified for growth/decline | Experienced a slight decline in the low-single digits |
The next big step in product innovation is scheduled for the second half of 2026. As part of the Consumer First Formula, Bath & Body Works, Inc. plans to introduce new product forms, vessels, and ingredient-led formulas in these core categories. This signals a deeper investment in product efficacy and formulation science to meet modern consumer needs, especially in the growing mass fragrance category.
To build long-term value, the strategy pivots toward franchise building over one-off novelty. Management plans to build enduring fragrance franchises around iconic scents, moving away from reliance on single collaborations. For context on collaboration scale, the brand's largest collaboration to date, the Disney Princess collection, featured 85 products. The Aromatherapy line, which includes stress relief and sleep products, is also highlighted as a key focus area.
The financial context for these investments is tight, but the company is funding them internally. The Q3 2025 net sales were $1.6 billion, a 1% year-over-year decline, with adjusted EPS at $0.35. The company has set a target of $250 million in cost savings over two years, with over half of those savings identified for 2026 to fund these revenue-generating initiatives. This cost discipline is necessary as the company revised its full-year 2025 net sales guidance to a decline of low single digits compared to fiscal 2024's $7,307 million in net sales.
You should track the following product-related metrics as the strategy rolls out:
- The success of expanding the 'Everyday Luxuries' line into body wash and body cream formats.
- The rate of assortment simplification, specifically the removal of non-core lines like hair care.
- The launch cadence of new ingredient-led formulas scheduled for the second half of 2026.
- The performance of new fragrance franchises versus the prior reliance on seasonal collaborations.
Finance: draft the 2026 capital expenditure plan allocation for R&D/Product Development by next Wednesday.
Bath & Body Works, Inc. (BBWI) - Ansoff Matrix: Diversification
You're looking at the most aggressive growth quadrant here, moving into new products in new markets. This is where the capital allocation decisions become critical, especially with the projected fiscal 2025 free cash flow landing around $650 million.
For piloting a new, higher-margin subscription box service for home fragrance in a test market outside the US/Canada, you should note the current international footprint. International operations generated net sales of $73 million in the third quarter of 2025, which was a 6.1% increase year-over-year. Remember, international markets only accounted for about 5% of total sales back in fiscal 2024, so any test market needs to be carefully selected to avoid diluting focus from the core U.S. and Canada business, which saw Stores net sales of $1.22 billion in Q3 2025.
When considering licensing the brand name to a third-party for small, non-fragrance home accessories in a new international territory, look at the existing physical reach. Bath & Body Works, Inc. operates over 2,400 stores worldwide. This physical presence, combined with nearly 40 million active loyalty members, provides immediate distribution leverage for any licensed product, even if the license is in a territory where direct retail presence is thin.
For acquiring a small, complementary, digitally-native brand (like sustainable cleaning products) and launching it via the existing international franchise network, the loyalty program is your built-in customer base. In the second quarter of 2025, loyalty members drove over 80% of U.S. sales, showing deep engagement. A new brand launched through this network could immediately tap into that base, though the international franchise network itself needs vetting for its capacity to handle a new product category launch.
Developing a line of efficacy-focused skincare and launching it exclusively through a new international marketplace channel speaks directly to the planned marketplace expansion. The company has a stated plan to launch on Amazon in 2026, aiming to recover between $60 million to $80 million in current gray market sales on that platform alone. This marketplace channel offers a direct path to new international consumers without the capital outlay of building out physical stores or dedicated e-commerce infrastructure in those regions.
Finally, investing a small portion of that projected $650 million free cash flow into a minority stake in a non-fragrance wellness tech startup is a classic diversification play. You have planned capital expenditures for 2025 at $240 million, primarily for real estate and technology, and another $400 million earmarked for share repurchases. That leaves a relatively small, yet strategic, amount available for minority investments outside of core operations, assuming the initial FCF guidance holds.
Here's a quick look at how the planned capital deployment compares to the available cash flow:
| Use of Cash | Amount (Millions USD) |
| Projected Fiscal 2025 Free Cash Flow | 650 |
| Planned Capital Expenditure (CapEx) | 240 |
| Planned Share Repurchases | 400 |
| Cash Used for Buybacks and CapEx | 640 |
| Remaining Cash Flow Before Dividends/Other | 10 |
The total planned deployment of $640 million against the $650 million projection leaves very little room for unplanned investment or absorbs the difference between the current $650 million FCF forecast and the earlier guidance of $750-$850 million.
The company returned $128 million to shareholders through dividends and buybacks in the third quarter alone, which needs to be factored against the annual dividend commitment of approximately $170 million.
- Q3 2025 Net Sales: $1,594 million
- Fiscal 2024 Net Sales: $7,307 million
- Fiscal 2024 Net Income: $798 million
- Targeted Cost Savings by 2027: $250 million
- Fiscal 2024 Adjusted EPS: $3.29
Disclaimer
All information, articles, and product details provided on this website are for general informational and educational purposes only. We do not claim any ownership over, nor do we intend to infringe upon, any trademarks, copyrights, logos, brand names, or other intellectual property mentioned or depicted on this site. Such intellectual property remains the property of its respective owners, and any references here are made solely for identification or informational purposes, without implying any affiliation, endorsement, or partnership.
We make no representations or warranties, express or implied, regarding the accuracy, completeness, or suitability of any content or products presented. Nothing on this website should be construed as legal, tax, investment, financial, medical, or other professional advice. In addition, no part of this site—including articles or product references—constitutes a solicitation, recommendation, endorsement, advertisement, or offer to buy or sell any securities, franchises, or other financial instruments, particularly in jurisdictions where such activity would be unlawful.
All content is of a general nature and may not address the specific circumstances of any individual or entity. It is not a substitute for professional advice or services. Any actions you take based on the information provided here are strictly at your own risk. You accept full responsibility for any decisions or outcomes arising from your use of this website and agree to release us from any liability in connection with your use of, or reliance upon, the content or products found herein.