
|
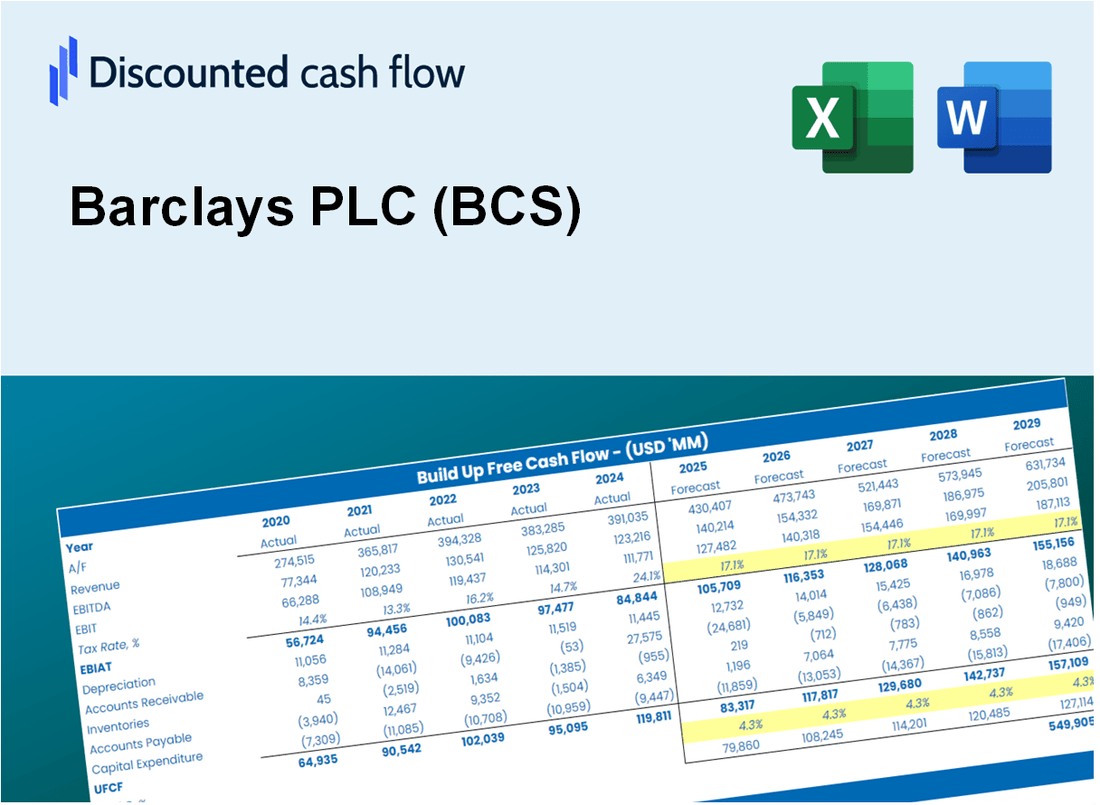
Barclays PLC (BCS) DCF Valuation |
Fully Editable: Tailor To Your Needs In Excel Or Sheets
Professional Design: Trusted, Industry-Standard Templates
Investor-Approved Valuation Models
MAC/PC Compatible, Fully Unlocked
No Expertise Is Needed; Easy To Follow
Barclays PLC (BCS) Bundle
Explore Barclays PLC's (BCS) financial future with our user-friendly DCF Calculator! Enter your projections for growth, margins, and expenses to calculate Barclays PLC's (BCS) intrinsic value and inform your investment decisions.
What You Will Get
- Real BCS Financials: Access to historical and projected data for precise valuation.
- Customizable Inputs: Adjust WACC, tax rates, revenue growth, and capital expenditures as needed.
- Dynamic Calculations: Intrinsic value and NPV are updated automatically.
- Scenario Analysis: Evaluate various scenarios to forecast Barclays PLC's future performance.
- User-Friendly Design: Designed for professionals while remaining easy for newcomers to navigate.
Key Features
- Comprehensive BCS Data: Pre-loaded with Barclays PLC's historical financial performance and future projections.
- Customizable Assumptions: Tailor revenue growth rates, profit margins, WACC, tax implications, and capital investments.
- Adaptive Valuation Framework: Automatic recalculations of Net Present Value (NPV) and intrinsic value based on user-defined parameters.
- Scenario Analysis: Develop various forecasting scenarios to evaluate different valuation results.
- Intuitive Interface: Designed for ease of use, catering to both experts and newcomers in finance.
How It Works
- Step 1: Download the prebuilt Excel template containing Barclays PLC’s (BCS) data.
- Step 2: Review the pre-filled sheets to familiarize yourself with the essential metrics.
- Step 3: Modify forecasts and assumptions in the editable yellow cells (WACC, growth, margins).
- Step 4: Immediately see the recalculated results, including Barclays PLC’s (BCS) intrinsic value.
- Step 5: Use the outputs to make informed investment choices or create detailed reports.
Why Choose This Calculator for Barclays PLC (BCS)?
- All-in-One Solution: Combines DCF, WACC, and financial ratio analyses tailored for Barclays PLC.
- Flexible Inputs: Modify yellow-highlighted fields to explore different financial scenarios.
- In-Depth Analysis: Automatically computes Barclays’ intrinsic value and Net Present Value.
- Preloaded Information: Historical and projected data provide reliable starting points for analysis.
- Expert-Level Tool: Perfect for financial analysts, investors, and business advisors focusing on Barclays PLC.
Who Should Use This Product?
- Finance Students: Explore financial modeling techniques and apply them to real-world data.
- Academics: Utilize advanced models in your teaching or research focused on Barclays PLC (BCS).
- Investors: Validate your investment strategies and assess valuation metrics for Barclays PLC (BCS).
- Analysts: Enhance your analysis process with a customizable financial model specifically for Barclays PLC (BCS).
- Small Business Owners: Understand how major financial institutions like Barclays PLC (BCS) are evaluated in the market.
What the Template Contains
- Pre-Filled Data: Contains Barclays PLC’s historical financials and projections.
- Discounted Cash Flow Model: Editable DCF valuation model featuring automatic calculations.
- Weighted Average Cost of Capital (WACC): A dedicated sheet for calculating WACC using custom inputs.
- Key Financial Ratios: Evaluate Barclays PLC’s profitability, efficiency, and leverage metrics.
- Customizable Inputs: Easily modify revenue growth, margins, and tax rates.
- Clear Dashboard: Visuals and tables summarizing essential valuation outcomes.
Disclaimer
All information, articles, and product details provided on this website are for general informational and educational purposes only. We do not claim any ownership over, nor do we intend to infringe upon, any trademarks, copyrights, logos, brand names, or other intellectual property mentioned or depicted on this site. Such intellectual property remains the property of its respective owners, and any references here are made solely for identification or informational purposes, without implying any affiliation, endorsement, or partnership.
We make no representations or warranties, express or implied, regarding the accuracy, completeness, or suitability of any content or products presented. Nothing on this website should be construed as legal, tax, investment, financial, medical, or other professional advice. In addition, no part of this site—including articles or product references—constitutes a solicitation, recommendation, endorsement, advertisement, or offer to buy or sell any securities, franchises, or other financial instruments, particularly in jurisdictions where such activity would be unlawful.
All content is of a general nature and may not address the specific circumstances of any individual or entity. It is not a substitute for professional advice or services. Any actions you take based on the information provided here are strictly at your own risk. You accept full responsibility for any decisions or outcomes arising from your use of this website and agree to release us from any liability in connection with your use of, or reliance upon, the content or products found herein.