
|
NV Bekaert SA (BEKB.BR) DCF Valuation |
Fully Editable: Tailor To Your Needs In Excel Or Sheets
Professional Design: Trusted, Industry-Standard Templates
Investor-Approved Valuation Models
MAC/PC Compatible, Fully Unlocked
No Expertise Is Needed; Easy To Follow
NV Bekaert SA (BEKB.BR) Bundle
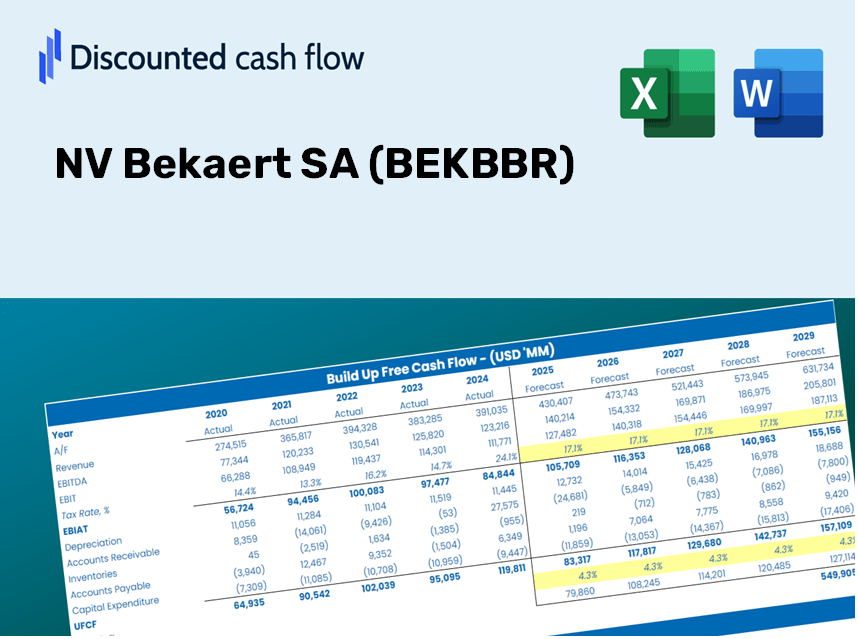
Designed for accuracy, our (BEKBBR) DCF Calculator enables you to evaluate NV Bekaert SA's valuation using real-world financial data, offering complete flexibility to modify all key parameters for improved projections.
Discounted Cash Flow (DCF) - (USD MM)
| Year | AY1 2020 |
AY2 2021 |
AY3 2022 |
AY4 2023 |
AY5 2024 |
FY1 2025 |
FY2 2026 |
FY3 2027 |
FY4 2028 |
FY5 2029 |
|---|---|---|---|---|---|---|---|---|---|---|
| Revenue | 3,772.4 | 4,839.7 | 5,651.8 | 4,327.9 | 3,957.8 | 4,087.4 | 4,221.2 | 4,359.5 | 4,502.2 | 4,649.6 |
| Revenue Growth, % | 0 | 28.29 | 16.78 | -23.42 | -8.55 | 3.27 | 3.27 | 3.27 | 3.27 | 3.27 |
| EBITDA | 415.4 | 704.1 | 505.7 | 482.1 | 451.3 | 466.4 | 481.7 | 497.4 | 513.7 | 530.5 |
| EBITDA, % | 11.01 | 14.55 | 8.95 | 11.14 | 11.4 | 11.41 | 11.41 | 11.41 | 11.41 | 11.41 |
| Depreciation | 185.9 | 184.9 | 192.3 | 173.0 | 155.7 | 164.2 | 169.5 | 175.1 | 180.8 | 186.7 |
| Depreciation, % | 4.93 | 3.82 | 3.4 | 4 | 3.93 | 4.02 | 4.02 | 4.02 | 4.02 | 4.02 |
| EBIT | 229.5 | 519.2 | 313.4 | 309.2 | 295.6 | 302.2 | 312.1 | 322.3 | 332.9 | 343.8 |
| EBIT, % | 6.08 | 10.73 | 5.54 | 7.14 | 7.47 | 7.39 | 7.39 | 7.39 | 7.39 | 7.39 |
| Total Cash | 990.5 | 757.3 | 732.9 | 632.9 | 506.7 | 672.8 | 694.8 | 717.6 | 741.0 | 765.3 |
| Total Cash, percent | .0 | .0 | .0 | .0 | .0 | .0 | .0 | .0 | .0 | .0 |
| Account Receivables | 749.7 | 954.9 | 927.2 | 712.6 | 744.0 | 746.1 | 770.6 | 795.8 | 821.9 | 848.8 |
| Account Receivables, % | 19.87 | 19.73 | 16.41 | 16.46 | 18.8 | 18.25 | 18.25 | 18.25 | 18.25 | 18.25 |
| Inventories | 683.5 | 1,121.2 | 1,143.1 | 788.5 | 834.0 | 824.0 | 851.0 | 878.9 | 907.7 | 937.4 |
| Inventories, % | 18.12 | 23.17 | 20.23 | 18.22 | 21.07 | 20.16 | 20.16 | 20.16 | 20.16 | 20.16 |
| Accounts Payable | 668.4 | 1,062.2 | 921.1 | 633.0 | 668.1 | 715.0 | 738.5 | 762.6 | 787.6 | 813.4 |
| Accounts Payable, % | 17.72 | 21.95 | 16.3 | 14.62 | 16.88 | 17.49 | 17.49 | 17.49 | 17.49 | 17.49 |
| Capital Expenditure | -107.7 | -152.5 | -185.1 | -191.3 | -221.8 | -157.8 | -163.0 | -168.3 | -173.8 | -179.5 |
| Capital Expenditure, % | -2.85 | -3.15 | -3.28 | -4.42 | -5.6 | -3.86 | -3.86 | -3.86 | -3.86 | -3.86 |
| Tax Rate, % | 7.27 | 7.27 | 7.27 | 7.27 | 7.27 | 7.27 | 7.27 | 7.27 | 7.27 | 7.27 |
| EBITAT | 181.6 | 442.8 | 266.5 | 249.9 | 274.1 | 255.7 | 264.1 | 272.7 | 281.6 | 290.9 |
| Depreciation | ||||||||||
| Changes in Account Receivables | ||||||||||
| Changes in Inventories | ||||||||||
| Changes in Accounts Payable | ||||||||||
| Capital Expenditure | ||||||||||
| UFCF | -504.9 | 226.0 | 138.4 | 512.7 | 166.3 | 316.8 | 242.6 | 250.6 | 258.8 | 267.2 |
| WACC, % | 10.5 | 10.5 | 10.5 | 10.5 | 10.5 | 10.5 | 10.5 | 10.5 | 10.5 | 10.5 |
| PV UFCF | ||||||||||
| SUM PV UFCF | 1,007.0 | |||||||||
| Long Term Growth Rate, % | 2.00 | |||||||||
| Free cash flow (T + 1) | 273 | |||||||||
| Terminal Value | 3,209 | |||||||||
| Present Terminal Value | 1,948 | |||||||||
| Enterprise Value | 2,955 | |||||||||
| Net Debt | -504 | |||||||||
| Equity Value | 3,459 | |||||||||
| Diluted Shares Outstanding, MM | 53 | |||||||||
| Equity Value Per Share | 65.86 |
What You'll Receive
- Customizable Excel Template: An entirely adaptable Excel-based DCF Calculator featuring pre-populated financial data for NV Bekaert SA (BEKBBR).
- Authentic Data: Access to historical figures and future projections (highlighted in the yellow cells).
- Adjustable Forecasts: Easily modify forecast parameters such as revenue growth, EBITDA percentage, and WACC.
- Instant Calculations: Observe the immediate effects of your inputs on NV Bekaert SA (BEKBBR)'s valuation.
- Professional Resource: Designed for use by investors, CFOs, consultants, and financial analysts.
- User-Centric Layout: Organized for simplicity and usability, complete with detailed instructions.
Key Features
- 🔍 Real-Life BEKBBR Financials: Pre-filled historical and projected data for NV Bekaert SA.
- ✏️ Fully Customizable Inputs: Modify all key parameters (yellow cells) including WACC, growth %, and tax rates.
- 📊 Professional DCF Valuation: Integrated formulas calculate NV Bekaert SA's intrinsic value using the Discounted Cash Flow approach.
- ⚡ Instant Results: Visualize NV Bekaert SA's valuation instantly after making adjustments.
- Scenario Analysis: Evaluate and compare potential outcomes for different financial assumptions side-by-side.
How It Functions
- Step 1: Download the Excel file.
- Step 2: Examine the pre-filled data for NV Bekaert SA (BEKBBR) (historical and projected).
- Step 3: Modify key assumptions (highlighted in yellow) based on your insights.
- Step 4: Observe the automatic recalculations reflecting NV Bekaert SA's (BEKBBR) intrinsic value.
- Step 5: Leverage the results for your investment decisions or reporting needs.
Why Opt for This Calculator?
- Designed for Experts: A sophisticated tool utilized by analysts, CFOs, and consultants.
- Accurate Financial Data: NV Bekaert SA’s historical and forecasted financials pre-loaded for precision.
- Flexible Scenario Analysis: Effortlessly simulate various forecasts and assumptions.
- Concise Outputs: Automatically computes intrinsic value, NPV, and essential metrics.
- User-Friendly: Step-by-step guidance to help you navigate the process.
Who Can Benefit from NV Bekaert SA (BEKBBR)?
- Investors: Gain clarity in your investment choices with our expert valuation solutions.
- Financial Analysts: Utilize our customizable DCF model to enhance your analysis efficiency.
- Consultants: Effortlessly modify the template for impactful client presentations and reports.
- Finance Enthusiasts: Expand your knowledge of valuation methods through practical, real-world scenarios.
- Educators and Students: Leverage this tool as an effective resource in finance education.
What the Template Contains
- Preloaded BEKBBR Data: Historical and forecasted financial information, encompassing revenue, EBIT, and capital expenditures.
- DCF and WACC Models: Professional-quality spreadsheets designed for calculating intrinsic value and Weighted Average Cost of Capital.
- Editable Inputs: Yellow-highlighted fields for customizing revenue growth, tax rates, and discount rates.
- Financial Statements: Detailed annual and quarterly financial reports for comprehensive analysis.
- Key Ratios: Metrics on profitability, leverage, and efficiency for performance assessment.
- Dashboard and Charts: Visual representations of valuation results and underlying assumptions.
Disclaimer
All information, articles, and product details provided on this website are for general informational and educational purposes only. We do not claim any ownership over, nor do we intend to infringe upon, any trademarks, copyrights, logos, brand names, or other intellectual property mentioned or depicted on this site. Such intellectual property remains the property of its respective owners, and any references here are made solely for identification or informational purposes, without implying any affiliation, endorsement, or partnership.
We make no representations or warranties, express or implied, regarding the accuracy, completeness, or suitability of any content or products presented. Nothing on this website should be construed as legal, tax, investment, financial, medical, or other professional advice. In addition, no part of this site—including articles or product references—constitutes a solicitation, recommendation, endorsement, advertisement, or offer to buy or sell any securities, franchises, or other financial instruments, particularly in jurisdictions where such activity would be unlawful.
All content is of a general nature and may not address the specific circumstances of any individual or entity. It is not a substitute for professional advice or services. Any actions you take based on the information provided here are strictly at your own risk. You accept full responsibility for any decisions or outcomes arising from your use of this website and agree to release us from any liability in connection with your use of, or reliance upon, the content or products found herein.