
|
BE Semiconductor Industries N.V. (BESI.AS) DCF Valuation |
Fully Editable: Tailor To Your Needs In Excel Or Sheets
Professional Design: Trusted, Industry-Standard Templates
Investor-Approved Valuation Models
MAC/PC Compatible, Fully Unlocked
No Expertise Is Needed; Easy To Follow
BE Semiconductor Industries N.V. (BESI.AS) Bundle
Discover the true potential of BE Semiconductor Industries N.V. (BESIAS) with our premium DCF Calculator! Adjust key assumptions, explore various scenarios, and evaluate the effects of changes on BE Semiconductor Industries N.V. (BESIAS) valuation – all within a user-friendly Excel template.
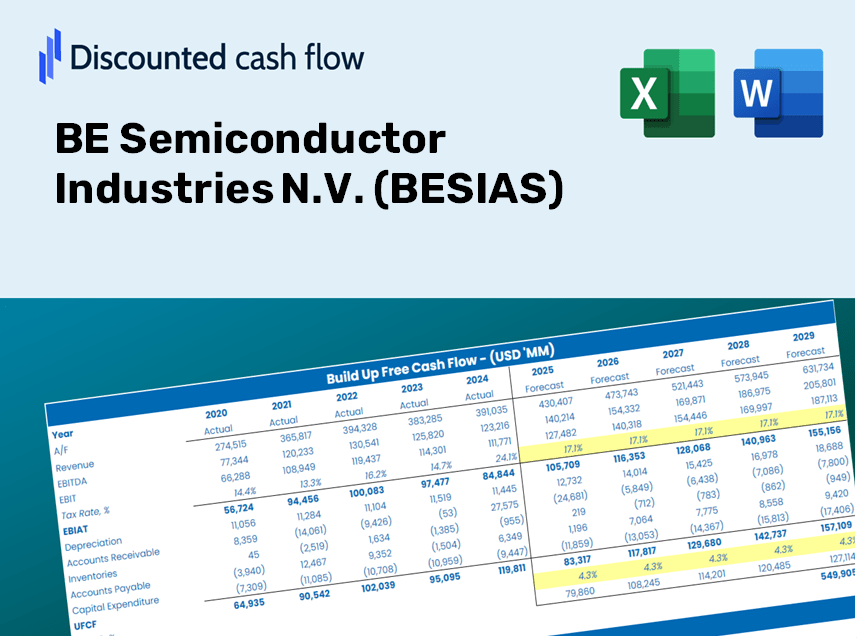
Discounted Cash Flow (DCF) - (USD MM)
| Year | AY1 2020 |
AY2 2021 |
AY3 2022 |
AY4 2023 |
AY5 2024 |
FY1 2025 |
FY2 2026 |
FY3 2027 |
FY4 2028 |
FY5 2029 |
|---|---|---|---|---|---|---|---|---|---|---|
| Revenue | 433.6 | 749.3 | 722.9 | 578.9 | 607.5 | 689.9 | 783.6 | 889.9 | 1,010.7 | 1,147.9 |
| Revenue Growth, % | 0 | 72.8 | -3.53 | -19.92 | 4.94 | 13.57 | 13.57 | 13.57 | 13.57 | 13.57 |
| EBITDA | 160.0 | 332.4 | 317.1 | 245.1 | 224.2 | 282.0 | 320.3 | 363.7 | 413.1 | 469.2 |
| EBITDA, % | 36.89 | 44.36 | 43.87 | 42.34 | 36.91 | 40.87 | 40.87 | 40.87 | 40.87 | 40.87 |
| Depreciation | 10.1 | 17.6 | 23.0 | 25.7 | 28.6 | 23.5 | 26.7 | 30.3 | 34.4 | 39.0 |
| Depreciation, % | 2.33 | 2.34 | 3.18 | 4.45 | 4.71 | 3.4 | 3.4 | 3.4 | 3.4 | 3.4 |
| EBIT | 149.9 | 314.8 | 294.1 | 219.4 | 195.6 | 258.5 | 293.6 | 333.5 | 378.7 | 430.1 |
| EBIT, % | 34.56 | 42.01 | 40.69 | 37.89 | 32.2 | 37.47 | 37.47 | 37.47 | 37.47 | 37.47 |
| Total Cash | 375.4 | 451.4 | 491.7 | 188.5 | 342.3 | 419.1 | 476.0 | 540.6 | 614.0 | 697.3 |
| Total Cash, percent | .0 | .0 | .0 | .0 | .0 | .0 | .0 | .0 | .0 | .0 |
| Account Receivables | 97.9 | 181.5 | 157.6 | 159.3 | 205.5 | 179.3 | 203.6 | 231.3 | 262.7 | 298.3 |
| Account Receivables, % | 22.58 | 24.22 | 21.8 | 27.52 | 33.82 | 25.99 | 25.99 | 25.99 | 25.99 | 25.99 |
| Inventories | 51.6 | 94.4 | 92.1 | 92.5 | 103.3 | 96.9 | 110.1 | 125.0 | 142.0 | 161.2 |
| Inventories, % | 11.91 | 12.6 | 12.74 | 15.98 | 17 | 14.05 | 14.05 | 14.05 | 14.05 | 14.05 |
| Accounts Payable | 44.0 | 74.7 | 41.4 | 46.9 | 52.6 | 58.8 | 66.8 | 75.9 | 86.1 | 97.8 |
| Accounts Payable, % | 10.15 | 9.97 | 5.73 | 8.1 | 8.66 | 8.52 | 8.52 | 8.52 | 8.52 | 8.52 |
| Capital Expenditure | -21.9 | -28.4 | -28.4 | -28.0 | -31.5 | -31.4 | -35.7 | -40.5 | -46.0 | -52.3 |
| Capital Expenditure, % | -5.04 | -3.78 | -3.93 | -4.84 | -5.18 | -4.56 | -4.56 | -4.56 | -4.56 | -4.56 |
| Tax Rate, % | 3.46 | 3.46 | 3.46 | 3.46 | 3.46 | 3.46 | 3.46 | 3.46 | 3.46 | 3.46 |
| EBITAT | 144.1 | 292.6 | 256.9 | 187.0 | 188.8 | 237.0 | 269.1 | 305.6 | 347.1 | 394.2 |
| Depreciation | ||||||||||
| Changes in Account Receivables | ||||||||||
| Changes in Inventories | ||||||||||
| Changes in Accounts Payable | ||||||||||
| Capital Expenditure | ||||||||||
| UFCF | 26.8 | 186.2 | 244.4 | 188.1 | 134.7 | 267.7 | 230.6 | 261.9 | 297.4 | 337.8 |
| WACC, % | 8.89 | 8.88 | 8.87 | 8.87 | 8.89 | 8.88 | 8.88 | 8.88 | 8.88 | 8.88 |
| PV UFCF | ||||||||||
| SUM PV UFCF | 1,075.6 | |||||||||
| Long Term Growth Rate, % | 4.00 | |||||||||
| Free cash flow (T + 1) | 351 | |||||||||
| Terminal Value | 7,200 | |||||||||
| Present Terminal Value | 4,705 | |||||||||
| Enterprise Value | 5,781 | |||||||||
| Net Debt | 202 | |||||||||
| Equity Value | 5,578 | |||||||||
| Diluted Shares Outstanding, MM | 82 | |||||||||
| Equity Value Per Share | 68.12 |
What You Will Receive
- Customizable Excel Template: An adaptable Excel-based DCF Calculator featuring pre-filled financial data for BESIAS (BESIAS).
- Accurate Market Data: Access to historical figures and projected estimates (highlighted in the yellow cells).
- Flexible Forecasting: Adjust key assumptions such as revenue growth, EBITDA margin, and WACC.
- Real-Time Calculations: Observe the immediate effects of your inputs on the valuation of BE Semiconductor Industries.
- Professional Resource: Designed for use by investors, CFOs, consultants, and financial analysts.
- Intuitive Interface: Organized for ease of understanding and navigation, complete with step-by-step guidance.
Key Features
- Customizable Forecast Inputs: Adjust essential variables such as revenue growth, EBITDA %, and capital investments.
- Instant DCF Valuation: Quickly computes intrinsic value, NPV, and other financial metrics.
- High-Precision Accuracy: Leverages BESIAS's real-world financial data for credible valuation results.
- Simplified Scenario Analysis: Effortlessly examine varying assumptions and contrast results.
- Efficiency Booster: Remove the hassle of creating intricate valuation models from the ground up.
How It Operates
- 1. Access the Template: Download and open the Excel template featuring BE Semiconductor Industries N.V.'s preloaded data.
- 2. Modify Assumptions: Adjust crucial inputs such as growth projections, WACC, and capital expenditures.
- 3. Get Instant Results: The DCF model automatically calculates intrinsic value and NPV in real-time.
- 4. Experiment with Scenarios: Evaluate various forecasts to explore different valuation possibilities.
- 5. Present with Assurance: Deliver professional valuation insights to back your strategic decisions.
Why Choose the BESIAS Calculator?
- Time-Saving: Avoid the hassle of building a DCF model from the ground up – it’s ready for you to use.
- Enhanced Accuracy: Dependable financial metrics and formulas minimize valuation errors.
- Fully Customizable: Adjust the model to match your specific assumptions and forecasts.
- User-Friendly: Intuitive charts and outputs simplify the analysis of results.
- Expert Approved: Crafted for industry professionals who prioritize precision and functionality.
Who Can Benefit from This Product?
- Investors: Evaluate BESIAS's market valuation before making stock transactions.
- CFOs and Financial Analysts: Optimize valuation workflows and assess financial forecasts.
- Startup Founders: Understand how large public companies like BE Semiconductor Industries N.V. are appraised.
- Consultants: Provide comprehensive valuation reports for your clientele.
- Students and Educators: Utilize real-time data to practice and teach valuation methodologies.
Contents of the Template
- Historical Data: Contains BESIAS’s previous financial performance and foundational forecasts.
- DCF and Levered DCF Models: Comprehensive templates designed to assess the intrinsic value of BESIAS.
- WACC Sheet: Pre-configured calculations for the Weighted Average Cost of Capital.
- Editable Inputs: Customize essential parameters such as growth rates, EBITDA %, and CAPEX assumptions.
- Quarterly and Annual Statements: A thorough analysis of BESIAS's financial statements.
- Interactive Dashboard: Dynamically visualize valuation outcomes and future projections.
Disclaimer
All information, articles, and product details provided on this website are for general informational and educational purposes only. We do not claim any ownership over, nor do we intend to infringe upon, any trademarks, copyrights, logos, brand names, or other intellectual property mentioned or depicted on this site. Such intellectual property remains the property of its respective owners, and any references here are made solely for identification or informational purposes, without implying any affiliation, endorsement, or partnership.
We make no representations or warranties, express or implied, regarding the accuracy, completeness, or suitability of any content or products presented. Nothing on this website should be construed as legal, tax, investment, financial, medical, or other professional advice. In addition, no part of this site—including articles or product references—constitutes a solicitation, recommendation, endorsement, advertisement, or offer to buy or sell any securities, franchises, or other financial instruments, particularly in jurisdictions where such activity would be unlawful.
All content is of a general nature and may not address the specific circumstances of any individual or entity. It is not a substitute for professional advice or services. Any actions you take based on the information provided here are strictly at your own risk. You accept full responsibility for any decisions or outcomes arising from your use of this website and agree to release us from any liability in connection with your use of, or reliance upon, the content or products found herein.