
|
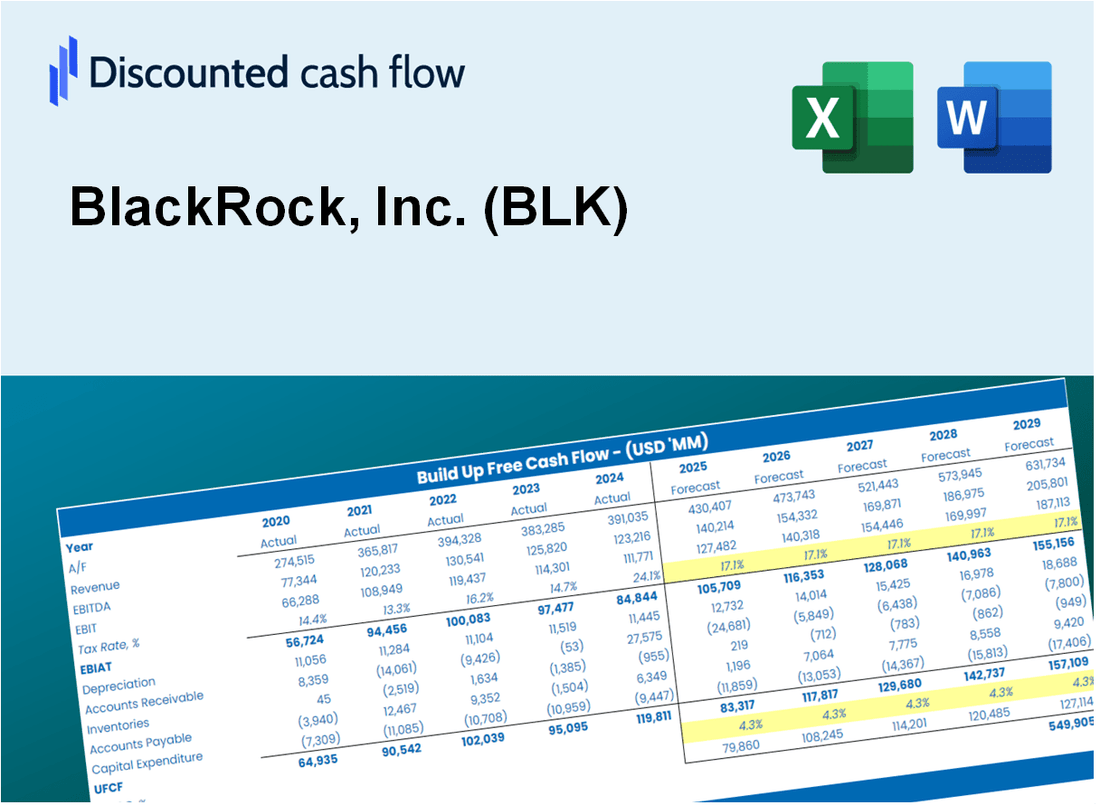
BlackRock, Inc. (BLK) DCF Valuation |
Fully Editable: Tailor To Your Needs In Excel Or Sheets
Professional Design: Trusted, Industry-Standard Templates
Investor-Approved Valuation Models
MAC/PC Compatible, Fully Unlocked
No Expertise Is Needed; Easy To Follow
BlackRock, Inc. (BLK) Bundle
Gain insights into your BlackRock, Inc. (BLK) valuation analysis using our sophisticated DCF Calculator! This Excel template comes preloaded with real data for (BLK), letting you adjust forecasts and assumptions to accurately determine the intrinsic value of BlackRock, Inc.
What You Will Get
- Editable Forecast Inputs: Effortlessly modify key assumptions (growth %, margins, WACC) to explore various scenarios.
- Real-World Data: BlackRock, Inc.'s (BLK) financial data pre-loaded to kickstart your analysis.
- Automatic DCF Outputs: The template computes Net Present Value (NPV) and intrinsic value automatically for you.
- Customizable and Professional: A sleek Excel model designed to suit your valuation requirements.
- Built for Analysts and Investors: Perfect for evaluating projections, confirming strategies, and enhancing efficiency.
Key Features
- Comprehensive Market Data: Gain access to reliable pre-loaded historical metrics and future forecasts.
- Adjustable Investment Assumptions: Modify highlighted cells for factors such as WACC, growth rates, and profit margins.
- Real-Time Analytics: Automatic recalculations for DCF, Net Present Value (NPV), and cash flow assessments.
- User-Friendly Interface: Intuitive charts and summaries to easily interpret your valuation outcomes.
- Suitable for All Levels: Designed for investors, CFOs, and consultants, offering a straightforward and accessible layout.
How It Works
- 1. Access the Template: Download and open the Excel file featuring BlackRock, Inc.'s preloaded financial data.
- 2. Modify Assumptions: Adjust key parameters such as growth rates, WACC, and capital expenditures.
- 3. See Results Immediately: The DCF model automatically calculates intrinsic value and NPV in real-time.
- 4. Explore Scenarios: Evaluate various forecasts to assess different valuation possibilities.
- 5. Present with Assurance: Deliver professional valuation insights to back your strategic decisions.
Why Choose This Calculator?
- Comprehensive Tool: Offers DCF, WACC, and financial ratio analyses all in one solution.
- Customizable Inputs: Modify yellow-highlighted cells to explore different scenarios.
- Detailed Insights: Automatically computes BlackRock, Inc.’s intrinsic value and Net Present Value.
- Preloaded Data: Historical and forecasted data provide reliable starting points.
- Professional Quality: Perfect for financial analysts, investors, and business consultants.
Who Should Use This Product?
- Investors: Accurately assess BlackRock’s fair value before making investment choices.
- CFOs: Utilize a professional-grade DCF model for financial reporting and analysis.
- Consultants: Easily customize the template for valuation reports for clients.
- Entrepreneurs: Discover insights into financial modeling applied by leading investment firms.
- Educators: Employ it as a teaching resource to illustrate valuation methodologies.
What the BlackRock, Inc. (BLK) Template Contains
- Comprehensive DCF Model: Editable template featuring detailed valuation calculations tailored for BlackRock.
- Real-World Data: BlackRock’s historical and projected financials preloaded for thorough analysis.
- Customizable Parameters: Modify WACC, growth rates, and tax assumptions to explore various scenarios.
- Financial Statements: Complete annual and quarterly breakdowns for enhanced insights into BlackRock's performance.
- Key Ratios: Integrated analysis for profitability, efficiency, and leverage specific to BlackRock.
- Dashboard with Visual Outputs: Charts and tables designed for clear, actionable results regarding BlackRock’s financial health.
Disclaimer
All information, articles, and product details provided on this website are for general informational and educational purposes only. We do not claim any ownership over, nor do we intend to infringe upon, any trademarks, copyrights, logos, brand names, or other intellectual property mentioned or depicted on this site. Such intellectual property remains the property of its respective owners, and any references here are made solely for identification or informational purposes, without implying any affiliation, endorsement, or partnership.
We make no representations or warranties, express or implied, regarding the accuracy, completeness, or suitability of any content or products presented. Nothing on this website should be construed as legal, tax, investment, financial, medical, or other professional advice. In addition, no part of this site—including articles or product references—constitutes a solicitation, recommendation, endorsement, advertisement, or offer to buy or sell any securities, franchises, or other financial instruments, particularly in jurisdictions where such activity would be unlawful.
All content is of a general nature and may not address the specific circumstances of any individual or entity. It is not a substitute for professional advice or services. Any actions you take based on the information provided here are strictly at your own risk. You accept full responsibility for any decisions or outcomes arising from your use of this website and agree to release us from any liability in connection with your use of, or reliance upon, the content or products found herein.