
|
BP p.l.c. (BP): SWOT Analysis [Apr-2026 Updated] |
Fully Editable: Tailor To Your Needs In Excel Or Sheets
Professional Design: Trusted, Industry-Standard Templates
Investor-Approved Valuation Models
MAC/PC Compatible, Fully Unlocked
No Expertise Is Needed; Easy To Follow
BP p.l.c. (BP) Bundle
You're analyzing BP p.l.c.'s (BP) massive strategic pivot-from an International Oil Company to an Integrated Energy Company-and the 2025 reality is a high-wire act. The company's core strength, its legacy oil and gas cash flow, must fund a capital-intensive transition while managing a significant net debt burden, which stood around $20.9 billion at the end of 2024. This SWOT analysis cuts through the complexity, mapping how BP's global scale and early moves in offshore wind and EV charging infrastructure stack up against the threats of extreme commodity price volatility and intense competition in the low-carbon sector, giving you the clear, actionable picture you need for your investment decisions.
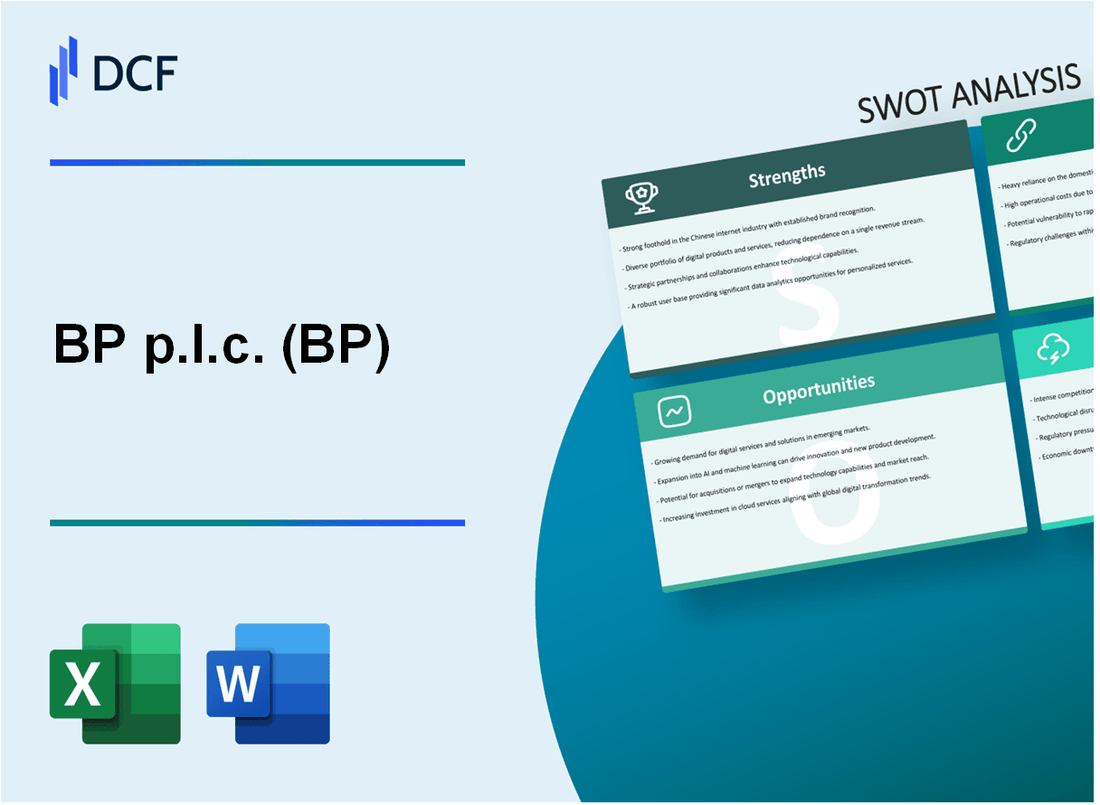
BP p.l.c. (BP) - SWOT Analysis: Strengths
Global scale and integrated value chain provide operational resilience.
BP's global footprint and integrated energy company (IEC) model are powerful strengths, allowing it to manage volatility across commodity markets. The company's upstream (exploration and production) and downstream (refining and marketing) segments, plus its trading arm, create a natural hedge against price swings. When crude prices drop, the refining business often benefits from lower feedstock costs, and vice versa. This integration is a core competitive advantage.
The company is intentionally focusing its downstream business to leverage these integrated positions, aiming to deliver an additional $3.5 billion to $4 billion in operating cash flow by 2027 from this focus alone. It's a simple, high-value strategy.
Strong cash flow from legacy oil and gas assets funds the energy transition.
The company has reset its strategy, recognizing that its traditional oil and gas business is the primary engine for funding the energy transition and delivering shareholder returns. This focus on resilient hydrocarbons ensures a strong, immediate cash flow. BP is increasing its annual investment in oil and gas to approximately $10 billion, which is about 20% higher than its previous guidance, to grow high-margin production.
This capital allocation is designed to grow adjusted free cash flow at a compound annual growth rate of over 20% to 2027, starting from a price-adjusted base of around $8 billion in 2024. The legacy business is the cash machine.
Here's the quick math on the 2025 capital frame:
| Metric | 2025 Target/Guidance | Source of Strength |
|---|---|---|
| Total Annual Capital Expenditure (Capex) | Around $14.5 billion (Guidance range: $13bn - $15bn to 2027) | Disciplined spending to boost returns. |
| Oil & Gas Investment (Upstream) | Approximately $10 billion per annum | High-margin production growth and cash flow generation. |
| Transition Businesses Investment | Between $1.5 billion and $2 billion per annum | Selective, high-return investment in new energy. |
Commitment to return capital to shareholders via dividends and share buybacks.
BP maintains a strong commitment to shareholder returns, which is defintely a key strength in attracting and retaining investors, especially following the strategic reset. The company has a clear financial framework that prioritizes resilient distributions, linking them directly to operating cash flow.
In the second quarter of 2025, BP increased its quarterly dividend by 4% to $0.0832 per ordinary share (or $0.4992 per American Depositary Share). The forward-looking guidance is to increase the dividend by at least 4% per share annually. Plus, the company has consistently executed significant share buyback programs. For the third quarter of 2025, BP completed a $750 million buyback program, and another program of around $750 million was commenced in November 2025. This return is guided to be 30-40% of its operating cash flow.
Early mover in transition areas like EV charging infrastructure and bioenergy.
While the strategy has become more focused, BP is still an early and significant player in specific, high-growth, low-carbon areas that integrate well with its existing customer base and infrastructure. The company is investing selectively in biogas, biofuels, and electric vehicle (EV) charging.
The EV charging business, bp pulse, is a major focus, leveraging the company's extensive network of retail sites. The scale is growing fast:
- BP pulse is expanding its public network in the US with a $100 million agreement to purchase ultra-fast chargers from Tesla.
- The company is also expanding its bioenergy business, with its acquired Archaea Energy expecting to start up 15-20 new renewable natural gas (RNG) plants per year through 2025.
- The overall renewables pipeline stood at 60.6 gigawatts (GW) at the end of Q4 2024, with a focus on capital-light partnerships for development.
BP p.l.c. (BP) - SWOT Analysis: Weaknesses
High Capital Expenditure (CapEx) and Strategic Inconsistency
You're looking at BP's strategic pivot, and honestly, the biggest weakness here is the sheer cost and inconsistency of the energy transition. For years, the company signaled a massive shift, which required huge capital expenditure (CapEx) to build out new, lower-carbon businesses, diverting funds from the high-return oil and gas core. Now, they've reset the strategy, which is a weakness in itself-it shows a lack of conviction or a miscalculation of the market.
BP's total expected CapEx for 2025 is around $14.5 billion. But look at the allocation: they've slashed the planned annual spending on low-carbon energy by over $5 billion compared to prior projections, aiming for just $1.5 billion to $2 billion per year in that segment. Meanwhile, they're boosting oil and gas investment to about $10 billion annually. That retreat from the green pivot, driven by investor pressure for higher short-term returns, creates strategic whiplash and raises questions about the long-term viability of their net-zero ambition.
Significant Net Debt Burden
A heavy debt load always limits your options, and BP is defintely carrying one. The significant net debt burden limits the company's financial flexibility, making large-scale, transformative acquisitions-or even weathering an unexpected market shock-much harder. At the end of the 2024 fiscal year, BP's net debt stood at a substantial $23.0 billion. That's a lot of money to service before you can pour it all into growth.
To be fair, BP is working to bring this down, with a stated goal of reducing net debt to between $14 billion and $18 billion by the end of 2027. But the debt level actually increased in the near-term, hitting $27.0 billion by the end of the first quarter of 2025, partly due to lower operating cash flow and the timing of divestment proceeds. This recent trend shows the challenge of deleveraging while simultaneously funding CapEx and shareholder returns.
| Financial Metric | End of 2024 (Actual) | 2025 (Expected/Guidance) | 2027 (Target) |
|---|---|---|---|
| Net Debt | $23.0 billion | $27.0 billion (Q1 2025) | $14-$18 billion |
| Total Capital Expenditure (CapEx) | $16.2 billion | Around $14.5 billion | $13-$15 billion (Frame) |
| Low-Carbon CapEx (Annual) | (Included in Total CapEx) | $1.5-$2.0 billion | $1.5-$2.0 billion |
Execution Risk in Lower-Margin New Businesses
The core of BP's weakness in the transition is the execution risk in scaling new, lower-margin businesses like renewables to replace the high-margin cash flow from oil and gas. The margins on a solar farm simply don't compare to a deepwater oil project. This is why the company is pivoting back.
The market has shown that scaling renewables is tough. For example, in the Spanish solar market, rapid deployment has led to oversupply and periods of near-zero power prices-a phenomenon called the 'duck curve'-which squeezes returns. BP is actively mitigating this risk by selling assets, including a 50% stake in Lightsource BP, and divesting its U.S. onshore wind business for $2 billion. This shows a clear difficulty in making these businesses profitable at the scale needed to replace fossil fuel earnings.
- Scaling renewables is capital-intensive and slow-to-return.
- Lower-carbon projects often yield single-digit returns on capital employed.
- Oil and gas projects can deliver double-digit returns much faster.
Brand and Reputational Damage from Past Incidents
Past environmental incidents, especially the 2010 Deepwater Horizon oil spill, still cast a long shadow over BP's brand and public trust. The incident, the largest marine oil spill in history, cost the company over $65 billion in total fines, clean-up, and settlements. BP pled guilty to 11 counts of manslaughter and other charges, which is a massive reputational anchor.
The damage is long-term. Even over a decade later, BP's corporate brand continues to lag behind competitors like ExxonMobil and Shell. This sustained negative perception means the company faces higher regulatory scrutiny and more resistance from environmental groups and the public when pursuing new projects, whether they are oil and gas or renewable energy ventures. This isn't just a PR problem; it's a cost of doing business that competitors don't carry to the same extent.
BP p.l.c. (BP) - SWOT Analysis: Opportunities
Accelerating demand for low-carbon power, hydrogen, and bioenergy, aligning with BP's strategic focus areas.
You have a clear opportunity in the accelerating shift toward lower-carbon energy. BP has strategically identified five transition growth engines: bioenergy, convenience, EV charging, hydrogen, and renewables & power. The company is putting its capital behind this shift, expecting investment in these areas to be above 40% of its total capital expenditure in 2025.
Here's the quick math: with a total expected capital expenditure of around $14.5 billion in 2025, this translates to a transition growth investment of over $5.8 billion. The company's specific target for transition growth investment in 2025 is in the range of $6-8 billion. This focus allows BP to capture value in high-growth, decarbonizing sectors like Sustainable Aviation Fuel (SAF) and low-carbon hydrogen.
- Biofuels demand is projected to increase by around 45% by 2035, driven by aviation's need for SAF.
- BP aims to develop 5-7 hydrogen and carbon capture projects globally by 2030.
Government incentives and regulatory tailwinds, particularly in the US and EU, for carbon capture and storage (CCS) and sustainable aviation fuel (SAF).
Regulatory frameworks in the US and EU are creating a strong financial pull for decarbonization technologies, which is a major opportunity. In the US, the federal Section 45Q tax credit for Carbon Capture and Storage (CCS) has been preserved and increased, providing a clear, long-term revenue stream for projects that sequester CO2. BP is actively supporting the US Inflation Reduction Act (IRA), which provides significant climate and energy provisions.
The European Union (EU) is also creating market certainty through mechanisms like Carbon Contracts for Differences (CCfDs) to accelerate CCS deployment. For SAF, BP is advocating for ambitious EU blending mandates, which, alongside incentives like those in Washington state, US, will dramatically increase demand for its bioenergy products. Honestly, these government programs turn high-cost, nascent technologies into commercially viable ventures almost overnight.
Expansion of high-margin retail and convenience businesses, leveraging existing global fuel station network.
The Customers and Products segment, which includes retail and convenience, is a consistent, high-margin business that provides cash flow stability. This division is a key transition growth engine, with an underlying profit before interest and tax of $1.7 billion in the third quarter of 2025, up from $1.5 billion in the prior quarter. The opportunity here is to deepen customer relationships and increase non-fuel revenue.
BP plans to add about 150 strategic convenience sites to its global network through the end of 2025. Over 100 of these new locations are planned for Poland alone, leveraging the partnership with grocer Auchan. The long-term goal is to double the convenience gross margin to $1.5 billion by 2030. Plus, they are investing $15 billion globally in convenience and EV charging, aiming to more than triple the number of global EV chargers from 29,000 in 2023 to 100,000 in 2030. That's a huge footprint expansion.
Potential to optimize and divest non-core legacy assets to fund the transition and reduce debt faster.
BP's disciplined portfolio management is a critical opportunity to self-fund the energy transition and strengthen the balance sheet. The company is targeting $20 billion in divestment proceeds by the end of 2027. For the 2025 fiscal year, BP expects to generate $3-4 billion from asset sales. Completed or announced disposal agreements for the full year 2025 already total approximately $5 billion.
This capital recycling is not just about cash; it's about focus. Divestments free up capital and management attention from non-core, lower-return assets, like the announced sale of non-controlling interests in US onshore midstream assets for $1.5 billion. Other major divestment actions in 2025 include:
| Divestment Target (2025 Focus) | Details | Strategic Goal |
|---|---|---|
| US Onshore Midstream Assets | Sale of non-controlling interests in Permian and Eagle Ford midstream assets for a total consideration of $1.5 billion. | Unlock capital while retaining operatorship and control. |
| Gelsenkirchen Refinery (ROG) | Marketing process announced for the sale of Ruhr Oel GmbH-BP Gelsenkirchen (ROG) in Germany and the Netherlands, with sale completion targeted for 2025. | Optimize refining portfolio and focus on core markets. |
| Netherlands Retail & EV Businesses | Agreement to divest around 300 retail sites and 23 EV charging hubs to Catom, expected to be completed by year-end 2025. | Focus on core convenience markets and streamline operations. |
| Castrol | Strategic review of the Castrol business is underway. | Maximize value from the lubricants business, potentially through a full or partial sale. |
These proceeds are defintely critical for meeting the net debt target of $14-18 billion by the end of 2027. Finance: track Q4 2025 divestment completion against the $5 billion announced target.
BP p.l.c. (BP) - SWOT Analysis: Threats
Extreme Volatility in Global Commodity Prices
You are navigating a market where crude oil and natural gas prices are wildly unpredictable, and this volatility directly impacts the cash you need to fund the energy transition. In Q1 2025 alone, BP reported a 49% drop in profits to $1.38 billion, down from $2.72 billion in Q1 the previous year. This sharp decline was a direct result of lower oil prices and tighter refining margins. Here's the quick math: a significant profit drop immediately shrinks the capital available for low-carbon investments.
The supply side is also a threat. The OPEC+ group, led by Saudi Arabia and Russia, decided to increase oil production by 411,000 barrels per day starting in June 2025, which has contributed to lower prices and increased market volatility. Daily price swings of 2-3% are now common. This creates a high-risk environment for your core business, making long-term capital allocation decisions for renewables much harder.
| Metric (2025 Fiscal Year) | Value/Change | Threat Implication |
|---|---|---|
| Q1 2025 Profit (Net Income) | $1.38 billion | 49% drop from Q1 2024, reducing capital for transition. |
| Daily Oil Price Volatility | 2-3% swings | Increased risk in trading and short-term revenue forecasting. |
| Low Carbon Investment (Revised Annual Target) | $1.5 billion to $2 billion | Significant cut from the previous $8 billion forecast for 2025, signaling a slower pivot. |
Increased Regulatory and Policy Risk
The regulatory landscape is a constant headwind, and new policies like carbon taxes or stricter emissions standards could raise your operating costs defintely. While BP has surpassed its 2025 operational emissions target-combined Scope 1 and 2 emissions were 32.1 MtCO2e in 2023, a 41% decrease from the 2019 baseline-the goalposts keep moving. The UK's commitment to net-zero by 2050, for example, puts continuous pressure on domestic energy companies to adapt their entire business model.
The real threat lies in the cost of compliance and the risk of stranded assets (assets that become obsolete or non-economical due to the energy transition). You are already incorporating an internal carbon cost into investment economics for major projects that exceed defined greenhouse gas (GHG) emissions thresholds. Furthermore, the company is targeting a low 0.20% methane intensity by the end of 2025, and failure to meet this could lead to heavy fines or reputational damage, especially as methane is a potent greenhouse gas.
Intense Competition in the Renewables Sector
Your strategic pivot back toward oil and gas, which includes cutting renewable energy funding, leaves you vulnerable to intense competition in the low-carbon space. BP is now planning to invest only $1.5 billion to $2 billion per year in low-carbon energies through 2027, a drastic reduction from the previously planned $8 billion in 2025. This reduced investment is happening while the market for renewable power purchase agreements (PPAs), where BP (via Lightsource bp) competes, is forecasted to grow from $32.01 billion in 2024 to $35.42 billion in 2025, a compound annual growth rate (CAGR) of 10.6%. That's a fast-growing market you're underspending in.
You face a margin squeeze from established utilities and pure-play green energy firms like SSE Renewables. Honestly, in 2024, BP still produced 66 times more energy from oil and gas than from renewables. This gap shows the scale of the challenge and the competitive disadvantage you face against firms that are 100% focused on green energy and benefit from greater economies of scale and specialized expertise in that domain.
Geopolitical Instability
Geopolitical instability, particularly in key oil and gas producing regions, remains a major threat to your supply chain security and operational continuity. The ongoing war in Ukraine, conflicts in the Middle East, and increasing use of trade tariffs are intensifying demands for national energy security globally. This can lead to increased self-reliance among nations, which in turn slows global trade and forces supply chains to move onshore, increasing your logistical costs.
Recent events, such as the Red Sea crisis, have created immediate bottlenecks in critical shipping routes, forcing you and your peers to scramble for alternative, more expensive transportation. Considering BP extracted 2.4 million barrels of oil equivalent per day (mmboe) in 2024, any disruption in a major region can instantly impact a massive portion of your daily production, leading to price spikes and supply contract issues. Sanctions are another major risk, capable of cutting off entire supply chains or markets overnight.
- Wars and conflicts disrupt key transportation routes and logistics.
- Trade tariffs and protectionism increase sourcing and operational costs.
- Sanctions restrict market access and limit supplier choices abruptly.
- Resource nationalism limits access to critical materials for both fossil and green projects.
Finance: Monitor the premium on shipping insurance for key routes and draft a 13-week cash view by Friday that models a 10% sustained increase in logistics costs due to geopolitical rerouting.
Disclaimer
All information, articles, and product details provided on this website are for general informational and educational purposes only. We do not claim any ownership over, nor do we intend to infringe upon, any trademarks, copyrights, logos, brand names, or other intellectual property mentioned or depicted on this site. Such intellectual property remains the property of its respective owners, and any references here are made solely for identification or informational purposes, without implying any affiliation, endorsement, or partnership.
We make no representations or warranties, express or implied, regarding the accuracy, completeness, or suitability of any content or products presented. Nothing on this website should be construed as legal, tax, investment, financial, medical, or other professional advice. In addition, no part of this site—including articles or product references—constitutes a solicitation, recommendation, endorsement, advertisement, or offer to buy or sell any securities, franchises, or other financial instruments, particularly in jurisdictions where such activity would be unlawful.
All content is of a general nature and may not address the specific circumstances of any individual or entity. It is not a substitute for professional advice or services. Any actions you take based on the information provided here are strictly at your own risk. You accept full responsibility for any decisions or outcomes arising from your use of this website and agree to release us from any liability in connection with your use of, or reliance upon, the content or products found herein.