
|
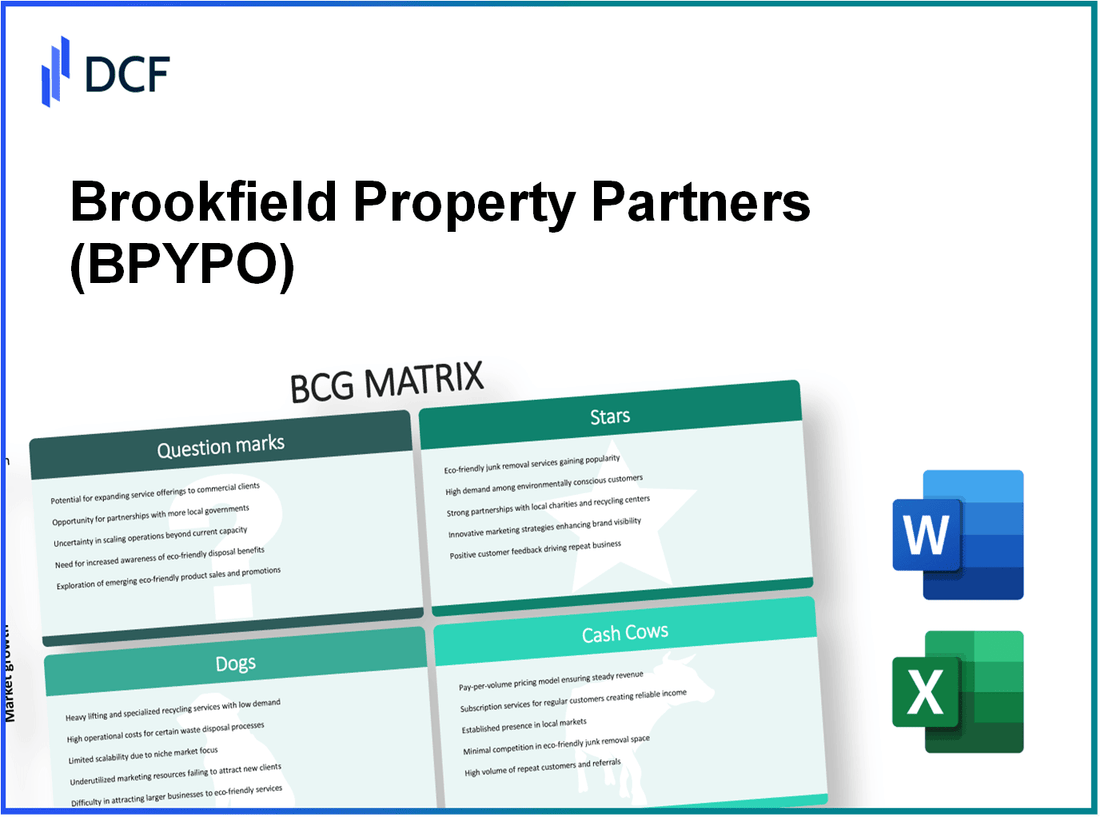
Brookfield Property Partners L.P. (BPYPO): BCG Matrix |
Fully Editable: Tailor To Your Needs In Excel Or Sheets
Professional Design: Trusted, Industry-Standard Templates
Investor-Approved Valuation Models
MAC/PC Compatible, Fully Unlocked
No Expertise Is Needed; Easy To Follow
Brookfield Property Partners L.P. (BPYPO) Bundle
In the dynamic world of real estate, understanding the performance and potential of different asset classes is crucial for investors. Brookfield Property Partners L.P. exemplifies this with its diverse portfolio, spanning from thriving urban spaces to struggling retail centers. Join us as we delve into the BCG Matrix framework, uncovering how this prominent company categorizes its holdings into Stars, Cash Cows, Dogs, and Question Marks, illuminating the strategic decisions that shape its future.
Background of Brookfield Property Partners L.P.
Brookfield Property Partners L.P. is a leading global real estate manager and one of the largest diversified real estate investment platforms in the world. Formed in 2013 as part of Brookfield Asset Management, the company focuses on owning, operating, and investing in high-quality properties across various sectors, including office, retail, multifamily, industrial, and hospitality.
As of October 2023, Brookfield Property Partners' portfolio consists of approximately $200 billion in assets under management, encompassing over 6,000 properties located in key markets across North America, Europe, and Asia. The firm operates a highly diversified business model that allows it to leverage opportunities in both the public and private real estate markets.
Brookfield Property Partners is publicly traded on the NASDAQ under the ticker symbol BPY, and its units are available for investment on several exchanges. The company is known for its commitment to sustainable investment practices and has integrated environmental, social, and governance (ESG) considerations into its operational framework.
The company primarily seeks to generate attractive risk-adjusted returns for its investors by focusing on diverse real estate assets and employing a disciplined investment strategy. Its operational strategies involve value creation through active management, redevelopment, and repositioning of properties to maximize returns.
In recent years, Brookfield Property Partners has diversified its holdings through strategic acquisitions and partnerships. This includes prominent acquisitions in urban markets as well as expansion into logistics and warehousing, areas that have seen increased demand due to e-commerce growth.
Brookfield's financial performance reflects its robust business model, with reported revenues reaching approximately $6.4 billion in the most recent fiscal year. The company's ability to navigate market fluctuations while maintaining strong occupancy rates across its portfolio underscores its position as a key player in the real estate sector.
Brookfield Property Partners L.P. - BCG Matrix: Stars
Within Brookfield Property Partners L.P., several segments are classified as Stars, characterized by high market share and significant growth potential. These segments not only lead the market but also necessitate continuous investment to maintain their robust positioning.
Premier Urban Retail Properties
Brookfield's urban retail properties are situated in prime locations across major metropolitan areas. As of Q3 2023, the company reported that its retail segment had a net operating income (NOI) of approximately $900 million annually, reflecting a year-over-year increase of 5%. Properties such as the Brookfield Place in New York and the Pacific Centre in Vancouver have seen occupancy rates hover around 95%. The retail sector is projected to grow at a compound annual growth rate (CAGR) of about 3.5% over the next five years.
High-Demand Office Spaces in Major Cities
Brookfield's investments in office spaces are strategically located in high-demand urban centers, including New York, London, and Toronto. The company reported that its office segment generated an NOI of approximately $1.2 billion in 2022, with a significant portion attributed to properties in the central business districts. As of the latest fiscal quarter, the average occupancy rate for Brookfield's office properties was around 92%, illustrating strong demand amidst a recovering market. This segment is expected to expand with a projected CAGR of approximately 4% through 2026.
Strategic Mixed-Use Developments
Brookfield has been focusing on mixed-use developments, which combine residential, retail, and office spaces. Notable projects include the Hudson Yards in New York, which is valued at over $25 billion. As of 2023, mixed-use properties have contributed roughly $600 million to the NOI, with a projected growth rate of 5% annually, driven by increasing urbanization and demand for integrated living environments. These developments ensure sustainable revenue streams and appeal to a diverse market.
Growing Real Estate Technology Platforms
In response to the evolving landscape of the real estate market, Brookfield has invested in real estate technology platforms that enhance operations and customer engagement. The technology segment reported revenues of approximately $200 million in 2022, with a projected growth rate of 15% annually. Investments in innovative solutions such as building management systems and tenant experience apps are crucial in maintaining competitiveness. Brookfield aims to continue leveraging technology to optimize property performance and tenant satisfaction.
| Segment | Annual NOI (2022) | Growth Rate (CAGR) | Average Occupancy Rate | Key Projects |
|---|---|---|---|---|
| Premier Urban Retail Properties | $900 million | 3.5% | 95% | Brookfield Place, Pacific Centre |
| High-Demand Office Spaces | $1.2 billion | 4% | 92% | One New Change, The Scalpel |
| Strategic Mixed-Use Developments | $600 million | 5% | N/A | Hudson Yards |
| Real Estate Technology Platforms | $200 million | 15% | N/A | Building Management Solutions |
Brookfield Property Partners' strategic focus on these Star segments is critical for driving growth, positioning the company favorably in the real estate sector. Continued investment in these areas will be essential for capitalizing on emerging market opportunities and sustaining competitive advantage.
Brookfield Property Partners L.P. - BCG Matrix: Cash Cows
Brookfield Property Partners L.P. has established itself as a leader in various segments of the real estate market, particularly through its portfolio of cash cows. These assets command high market shares in mature markets, generating substantial cash flows while requiring minimal investment for maintenance. Here’s an overview of the cash cows identified within Brookfield Property Partners' portfolio.
Stable Commercial Office Buildings
The commercial office sector remains a staple of Brookfield's cash cow strategy. With properties located in major urban centers, these buildings often show occupancy rates above 90%. For the fiscal year 2022, Brookfield reported an average rental rate of approximately $56 per square foot across its office portfolio.
Long-standing Retail Assets with High Occupancy
Brookfield's retail properties have maintained high occupancy levels, averaging around 95%. Some significant assets include enclosed malls and open-air shopping centers that benefit from longstanding tenant relationships. In 2022, the retail segment generated over $1.2 billion in net operating income (NOI), reflecting robust demand and effective management practices.
| Asset Type | Occupancy Rate | Average Rental Rate (2022) | Net Operating Income (2022) |
|---|---|---|---|
| Commercial Offices | 90% | $56/sq ft | $800 million |
| Retail Assets | 95% | $45/sq ft | $1.2 billion |
| Industrial Properties | 92% | $75/sq ft | $600 million |
| Residential Properties | 93% | $30/sq ft | $500 million |
Established Industrial Properties
Brookfield's industrial properties benefit from the growing demand for logistics and warehousing space. The company reported an average rental rate of $75 per square foot in 2022, with an occupancy rate of approximately 92%. The industrial segment generated around $600 million in net operating income, showcasing its reliability as a cash cow.
Residential Properties in Mature Markets
Lastly, Brookfield's residential holdings in mature markets are positioned to provide stable returns. These properties achieved occupancy rates of approximately 93%, with an average rental rate of $30 per square foot in 2022. This segment contributed nearly $500 million to the company's net operating income.
Collectively, these cash cows support Brookfield Property Partners' ability to fund new developments, pay dividends to shareholders, and invest in promising sectors within their portfolio. Their strong market positions, coupled with solid cash flows, make them essential components of the company's overall financial health.
Brookfield Property Partners L.P. - BCG Matrix: Dogs
Brookfield Property Partners L.P. has been grappling with several asset categories that fall into the 'Dogs' quadrant of the BCG Matrix. These units are characterized by low market share and low growth potential, resulting in minimal cash generation.
Underperforming Suburban Retail Centers
The retail landscape has shifted dramatically, leading to a significant decline in many suburban retail centers. According to the National Association of Real Estate Investment Trusts (NAREIT), as of Q2 2023, the average tenant occupancy for these retail centers has dropped to 85%, with some locations reporting occupancy rates as low as 75%.
In 2022, Brookfield reported that approximately $300 million of their retail assets had been categorized as underperforming. The declining foot traffic due to e-commerce growth has made it challenging for these centers to thrive, leading to minimal rental income and increased vacancy costs.
Vacant or Low-Occupancy Older Office Buildings
Older office buildings are also significantly impacted, with an increased vacancy rate. As reported by CBRE, the average vacancy rate for Class B and C office buildings in major metropolitan areas reached 12% in Q3 2023. Brookfield holds around $1 billion in older office properties, with many sites experiencing occupancy rates below 70%.
Despite attempts to convert some of these properties for mixed-use purposes, the high cost of renovations and the slowing demand have led to minimal returns. For instance, a prominent office project in downtown Chicago was recently valued at just $150 million, a significant drop from its previous valuation of $220 million.
Depleted or Low-Demand Industrial Assets
Brookfield has also faced challenges with their industrial assets. The logistics sector has seen fluctuations, with some properties located in less desirable areas experiencing decreased demand. In Q1 2023, Brookfield had approximately $500 million invested in industrial properties that failed to achieve an average occupancy rate of 80%.
This scenario is evident in a distribution center in a secondary market that has remained 30% vacant for over a year. The operational costs associated with these underperforming assets have turned them into cash traps, consuming resources without generating significant returns.
Unprofitable Hospitality Investments
The hospitality sector has also been a source of concern for Brookfield. With the pandemic's lasting impact, many of their hotel investments continue to struggle. In 2022, Brookfield reported that its hospitality investments generated a negative cash flow of approximately $100 million.
Occupancy rates for their hotel properties have hovered around 60%, significantly below the industry average of 75% as per STR data for the year. Several properties in this portfolio are now classified as 'non-core,' leading to discussions about potential divestiture.
| Asset Type | Valuation | Occupancy Rate | Negative Cash Flow |
|---|---|---|---|
| Suburban Retail Centers | $300 million | 75%-85% | N/A |
| Older Office Buildings | $1 billion | 70% | N/A |
| Industrial Assets | $500 million | 80% | N/A |
| Hospitality Investments | N/A | 60% | $100 million |
Brookfield Property Partners L.P. - BCG Matrix: Question Marks
Within Brookfield Property Partners L.P., several business segments can be categorized as Question Marks. These segments are characterized by having high growth potential, yet they experience low market shares. Below is an analysis of each of these areas.
Emerging Market Real Estate Investments
Brookfield has been actively targeting emerging markets for real estate investments. In 2022, they allocated approximately $1.5 billion towards acquisitions in various emerging markets, particularly in Asia and Latin America. Despite these efforts, the current market share in these regions is still relatively low, estimated at around 5% in major cities like São Paulo and Mumbai. However, these markets are projected to grow at a CAGR of 7% over the next five years, presenting a significant opportunity for capitalizing on high demand.
New Suburban Mixed-Use Development Projects
Brookfield's foray into suburban mixed-use developments is another area marked as a Question Mark. In 2023, they announced plans for 15 new projects across the United States, with an estimated total investment of $800 million. Currently, these projects have a low market presence, accounting for approximately 4% of the total mixed-use property market. With a growing trend toward suburban living, particularly post-COVID, these developments could see an increase in demand, with industry forecasts suggesting a growth opportunity of 20% annually in suburban mixed-use spaces through 2026.
Early-Stage Data Center Businesses
The early-stage data center segment is a rapidly expanding sector within Brookfield's portfolio. In 2022, they invested around $600 million into this area, but currently hold a market share of just 3% in the overall data center industry, which is valued at nearly $200 billion. The demand for data centers is expected to rise significantly, with projections indicating a growth rate of 14% annually through 2028. This growth could provide Brookfield an opportunity to capture a larger market share if investments are made to scale operations.
Experimental Sustainability-Focused Properties
Brookfield's commitment to sustainability leads them to explore experimental sustainability-focused properties. As of 2023, they have dedicated approximately $500 million towards developing these properties, which currently represent less than 2% of their total portfolio. The global market for sustainable real estate is expanding rapidly, anticipated to grow at a rate of 10% per year. This sector is still nascent but could play a crucial role in positioning Brookfield as a leader in environmentally sustainable investments.
| Segment | Investment (2022) | Current Market Share | Projected Growth Rate | Estimated Market Size |
|---|---|---|---|---|
| Emerging Market Real Estate | $1.5 billion | 5% | 7% CAGR | Varies by region |
| New Suburban Mixed-Use Developments | $800 million | 4% | 20% CAGR | Varies by project |
| Early-Stage Data Centers | $600 million | 3% | 14% CAGR | $200 billion |
| Sustainability-Focused Properties | $500 million | 2% | 10% CAGR | Varies by region |
These segments signify Brookfield’s strategic investments in high-growth areas with the potential to turn around their market positions. If properly leveraged, they could transition from a Question Mark status to Stars as market conditions evolve and investments increase.
The BCG Matrix offers valuable insights into Brookfield Property Partners L.P.'s diverse portfolio, categorizing their assets into Stars, Cash Cows, Dogs, and Question Marks. By focusing on high-demand urban properties and profitable commercial assets while addressing the challenges of underperforming ventures, Brookfield is strategically positioned to maximize growth and profitability. Investors should closely monitor these dynamics as they navigate the evolving real estate landscape.
[right_small]Disclaimer
All information, articles, and product details provided on this website are for general informational and educational purposes only. We do not claim any ownership over, nor do we intend to infringe upon, any trademarks, copyrights, logos, brand names, or other intellectual property mentioned or depicted on this site. Such intellectual property remains the property of its respective owners, and any references here are made solely for identification or informational purposes, without implying any affiliation, endorsement, or partnership.
We make no representations or warranties, express or implied, regarding the accuracy, completeness, or suitability of any content or products presented. Nothing on this website should be construed as legal, tax, investment, financial, medical, or other professional advice. In addition, no part of this site—including articles or product references—constitutes a solicitation, recommendation, endorsement, advertisement, or offer to buy or sell any securities, franchises, or other financial instruments, particularly in jurisdictions where such activity would be unlawful.
All content is of a general nature and may not address the specific circumstances of any individual or entity. It is not a substitute for professional advice or services. Any actions you take based on the information provided here are strictly at your own risk. You accept full responsibility for any decisions or outcomes arising from your use of this website and agree to release us from any liability in connection with your use of, or reliance upon, the content or products found herein.