
|
Burberry Group plc (BRBY.L) DCF Valuation |
Fully Editable: Tailor To Your Needs In Excel Or Sheets
Professional Design: Trusted, Industry-Standard Templates
Investor-Approved Valuation Models
MAC/PC Compatible, Fully Unlocked
No Expertise Is Needed; Easy To Follow
Burberry Group plc (BRBY.L) Bundle
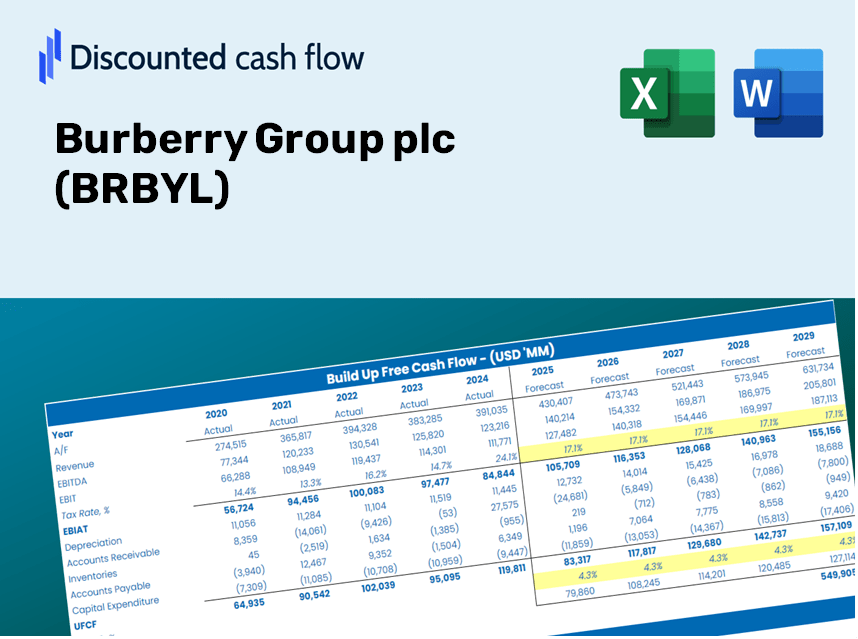
Gain insights into your Burberry Group plc (BRBYL) valuation analysis using our sophisticated DCF Calculator! Preloaded with accurate Burberry Group plc (BRBYL) data, this Excel template enables you to adjust forecasts and assumptions to determine the intrinsic value of Burberry Group plc (BRBYL) with precision.
Discounted Cash Flow (DCF) - (USD MM)
| Year | AY1 2021 |
AY2 2022 |
AY3 2023 |
AY4 2024 |
AY5 2025 |
FY1 2026 |
FY2 2027 |
FY3 2028 |
FY4 2029 |
FY5 2030 |
|---|---|---|---|---|---|---|---|---|---|---|
| Revenue | 2,343.9 | 2,826.0 | 3,094.0 | 2,968.0 | 2,461.0 | 2,515.7 | 2,571.7 | 2,628.9 | 2,687.4 | 2,747.1 |
| Revenue Growth, % | 0 | 20.57 | 9.48 | -4.07 | -17.08 | 2.22 | 2.22 | 2.22 | 2.22 | 2.22 |
| EBITDA | 800.2 | 858.0 | 1,017.0 | 816.0 | 428.0 | 715.8 | 731.7 | 747.9 | 764.6 | 781.6 |
| EBITDA, % | 34.14 | 30.36 | 32.87 | 27.49 | 17.39 | 28.45 | 28.45 | 28.45 | 28.45 | 28.45 |
| Depreciation | 276.7 | 313.0 | 341.0 | 379.0 | 413.0 | 319.3 | 326.4 | 333.6 | 341.0 | 348.6 |
| Depreciation, % | 11.81 | 11.08 | 11.02 | 12.77 | 16.78 | 12.69 | 12.69 | 12.69 | 12.69 | 12.69 |
| EBIT | 523.5 | 545.0 | 676.0 | 437.0 | 15.0 | 396.5 | 405.3 | 414.3 | 423.5 | 433.0 |
| EBIT, % | 22.33 | 19.29 | 21.85 | 14.72 | 0.60951 | 15.76 | 15.76 | 15.76 | 15.76 | 15.76 |
| Total Cash | 1,261.3 | 1,222.0 | 1,026.0 | 441.0 | 813.0 | 896.1 | 916.1 | 936.5 | 957.3 | 978.6 |
| Total Cash, percent | .0 | .0 | .0 | .0 | .0 | .0 | .0 | .0 | .0 | .0 |
| Account Receivables | 147.0 | 251.0 | 275.0 | 307.0 | 281.0 | 230.5 | 235.6 | 240.8 | 246.2 | 251.7 |
| Account Receivables, % | 6.27 | 8.88 | 8.89 | 10.34 | 11.42 | 9.16 | 9.16 | 9.16 | 9.16 | 9.16 |
| Inventories | 402.1 | 426.0 | 447.0 | 507.0 | 424.0 | 407.5 | 416.6 | 425.8 | 435.3 | 445.0 |
| Inventories, % | 17.16 | 15.07 | 14.45 | 17.08 | 17.23 | 16.2 | 16.2 | 16.2 | 16.2 | 16.2 |
| Accounts Payable | 129.0 | 181.0 | 186.0 | 180.0 | 146.0 | 150.5 | 153.9 | 157.3 | 160.8 | 164.4 |
| Accounts Payable, % | 5.5 | 6.4 | 6.01 | 6.06 | 5.93 | 5.98 | 5.98 | 5.98 | 5.98 | 5.98 |
| Capital Expenditure | -117.7 | -165.0 | -179.0 | -212.0 | -151.0 | -150.6 | -153.9 | -157.3 | -160.8 | -164.4 |
| Capital Expenditure, % | -5.02 | -5.84 | -5.79 | -7.14 | -6.14 | -5.98 | -5.98 | -5.98 | -5.98 | -5.98 |
| Tax Rate, % | -13.64 | -13.64 | -13.64 | -13.64 | -13.64 | -13.64 | -13.64 | -13.64 | -13.64 | -13.64 |
| EBITAT | 401.5 | 422.3 | 522.5 | 308.1 | 17.0 | 318.8 | 325.9 | 333.1 | 340.5 | 348.1 |
| Depreciation | ||||||||||
| Changes in Account Receivables | ||||||||||
| Changes in Inventories | ||||||||||
| Changes in Accounts Payable | ||||||||||
| Capital Expenditure | ||||||||||
| UFCF | 140.4 | 494.4 | 644.5 | 377.1 | 354.0 | 559.0 | 487.5 | 498.3 | 509.4 | 520.7 |
| WACC, % | 6.11 | 6.12 | 6.12 | 6.02 | 6.44 | 6.16 | 6.16 | 6.16 | 6.16 | 6.16 |
| PV UFCF | ||||||||||
| SUM PV UFCF | 2,162.8 | |||||||||
| Long Term Growth Rate, % | 2.00 | |||||||||
| Free cash flow (T + 1) | 531 | |||||||||
| Terminal Value | 12,763 | |||||||||
| Present Terminal Value | 9,465 | |||||||||
| Enterprise Value | 11,628 | |||||||||
| Net Debt | 1,111 | |||||||||
| Equity Value | 10,517 | |||||||||
| Diluted Shares Outstanding, MM | 358 | |||||||||
| Equity Value Per Share | 2,934.36 |
What You'll Receive
- Genuine Burberry Financials: Access to both historical and projected data for precise valuation.
- Customizable Inputs: Adjust WACC, tax rates, revenue growth, and capital expenditures as needed.
- Automated Calculations: Intrinsic value and NPV are calculated in real-time.
- Scenario Analysis: Explore various scenarios to assess Burberry’s future performance.
- User-Friendly Design: Designed for professionals while remaining approachable for newcomers.
Key Features
- Comprehensive DCF Calculator: Offers detailed unlevered and levered DCF valuation models tailored for Burberry Group plc (BRBYL).
- WACC Calculator: Features a pre-built Weighted Average Cost of Capital sheet with adjustable inputs specific to Burberry.
- Customizable Forecast Assumptions: Easily modify growth rates, capital investments, and discount rates to suit Burberry's financial outlook.
- Integrated Financial Ratios: Evaluate profitability, leverage, and efficiency metrics for Burberry Group plc (BRBYL).
- Interactive Dashboard and Charts: Visual representations highlight essential valuation metrics for straightforward analysis.
How It Works
- Step 1: Download the Excel file.
- Step 2: Examine Burberry’s pre-filled financial data and forecasts.
- Step 3: Adjust key inputs such as revenue growth, WACC, and tax rates (highlighted cells).
- Step 4: Observe the DCF model update in real-time as you modify your assumptions.
- Step 5: Evaluate the outputs and utilize the results for your investment decisions.
Why Choose This Calculator for Burberry Group plc (BRBYL)?
- User-Friendly Interface: Perfectly suited for both novices and seasoned professionals.
- Customizable Parameters: Effortlessly adjust inputs to suit your financial analysis needs.
- Real-Time Adjustments: Watch Burberry's valuation update instantly as you change the inputs.
- Preloaded Financial Data: Features existing financial information for Burberry for swift evaluations.
- Relied Upon by Experts: Favored by investors and analysts for making well-informed decisions.
Who Can Benefit from This Product?
- Investors: Make informed decisions with a top-tier valuation tool tailored for your needs.
- Financial Analysts: Streamline your workflow with a customizable DCF model that's pre-built for efficiency.
- Consultants: Easily modify the template for impactful client presentations or detailed reports.
- Finance Aficionados: Enhance your grasp of valuation methods by exploring practical, real-world examples.
- Educators and Students: Utilize it as a hands-on learning resource in finance-focused educational settings.
Contents of the Template
- Preloaded BRBYL Data: Historical and forecasted financial information, including revenue, EBIT, and capital expenditures.
- DCF and WACC Models: High-quality spreadsheets for determining intrinsic value and Weighted Average Cost of Capital.
- Editable Inputs: Yellow-highlighted fields for modifying revenue growth, tax rates, and discount rates.
- Financial Statements: Detailed annual and quarterly financial statements for in-depth analysis.
- Key Ratios: Metrics on profitability, leverage, and efficiency to assess performance.
- Dashboard and Charts: Visual representations of valuation results and underlying assumptions.
Disclaimer
All information, articles, and product details provided on this website are for general informational and educational purposes only. We do not claim any ownership over, nor do we intend to infringe upon, any trademarks, copyrights, logos, brand names, or other intellectual property mentioned or depicted on this site. Such intellectual property remains the property of its respective owners, and any references here are made solely for identification or informational purposes, without implying any affiliation, endorsement, or partnership.
We make no representations or warranties, express or implied, regarding the accuracy, completeness, or suitability of any content or products presented. Nothing on this website should be construed as legal, tax, investment, financial, medical, or other professional advice. In addition, no part of this site—including articles or product references—constitutes a solicitation, recommendation, endorsement, advertisement, or offer to buy or sell any securities, franchises, or other financial instruments, particularly in jurisdictions where such activity would be unlawful.
All content is of a general nature and may not address the specific circumstances of any individual or entity. It is not a substitute for professional advice or services. Any actions you take based on the information provided here are strictly at your own risk. You accept full responsibility for any decisions or outcomes arising from your use of this website and agree to release us from any liability in connection with your use of, or reliance upon, the content or products found herein.