
|
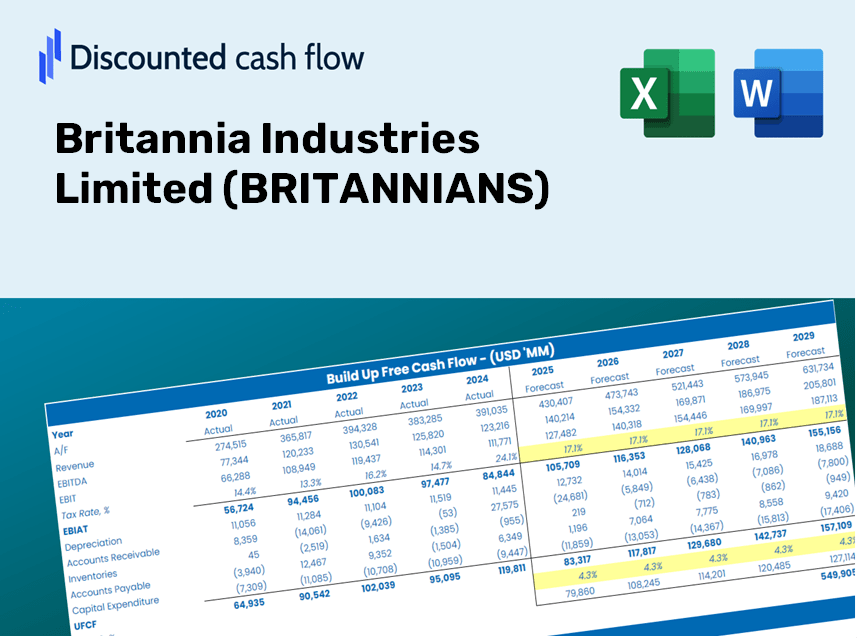
Britannia Industries Limited (BRITANNIA.NS) DCF Valuation |
Fully Editable: Tailor To Your Needs In Excel Or Sheets
Professional Design: Trusted, Industry-Standard Templates
Investor-Approved Valuation Models
MAC/PC Compatible, Fully Unlocked
No Expertise Is Needed; Easy To Follow
Britannia Industries Limited (BRITANNIA.NS) Bundle
Simplify Britannia Industries Limited (BRITANNIANS) valuation with this customizable DCF Calculator! Featuring real Britannia Industries Limited (BRITANNIANS) financials and adjustable forecast inputs, you can test scenarios and uncover Britannia Industries Limited (BRITANNIANS) fair value in minutes.
What You Will Gain
- Authentic BRITANNIANS Financial Data: Pre-populated with Britannia Industries' historical and forecasted figures for thorough analysis.
- Fully Customizable Template: Easily adjust essential inputs such as revenue growth, WACC, and EBITDA percentage.
- Instant Calculations: View the intrinsic value of Britannia Industries update in real-time as you modify inputs.
- Comprehensive Valuation Tool: Tailored for investors, analysts, and consultants aiming for precise DCF outcomes.
- User-Centric Interface: Intuitive layout and straightforward instructions suitable for all skill levels.
Key Features of Britannia Industries Limited (BRITANNIANS)
- Authentic Financial Data: Gain access to reliable pre-loaded historical figures and future forecasts.
- Adjustable Forecast Parameters: Modify yellow-highlighted cells, including WACC, growth rates, and profit margins.
- Real-Time Calculations: Enjoy automatic updates for DCF, Net Present Value (NPV), and cash flow assessments.
- User-Friendly Dashboard: View straightforward charts and summaries to easily interpret your valuation findings.
- Designed for All Skill Levels: A straightforward, intuitive layout tailored for investors, CFOs, and consultants alike.
How It Functions
- Download: Get access to the pre-configured Excel file featuring Britannia Industries Limited’s financial data.
- Customize: Modify forecasts, including revenue growth, EBITDA %, and WACC according to your analysis.
- Automatic Updates: The intrinsic value and NPV calculations refresh in real-time as you make adjustments.
- Explore Scenarios: Develop various projections and evaluate results instantly for better insights.
- Strategic Decisions: Utilize the valuation results to inform your investment decisions regarding Britannia Industries Limited (BRITANNIANS).
Why Opt for the Britannia Calculator?
- Time-Efficient: Skip the hassle of building a DCF model from the ground up – it’s ready for immediate use.
- Enhanced Precision: Dependable financial data and formulas minimize valuation errors.
- Completely Customizable: Adjust the model to align with your unique assumptions and forecasts.
- User-Friendly: Intuitive charts and outputs make interpreting the results straightforward.
- Endorsed by Professionals: Crafted for experts who prioritize accuracy and functionality.
Who Can Benefit from This Product?
- Investors: Assess Britannia Industries Limited’s (BRITANNIANS) valuation before making stock transactions.
- CFOs and Financial Analysts: Enhance valuation methodologies and validate financial forecasts.
- Startup Founders: Gain insights into how large public entities like Britannia Industries Limited are valued.
- Consultants: Create detailed valuation reports for your clientele.
- Students and Educators: Utilize real market data to learn and teach valuation strategies.
Contents of the Template
- Preloaded BRITANNIANS Data: Historical and projected financial data, encompassing revenue, EBIT, and capital expenditures.
- DCF and WACC Models: Professionally designed sheets for determining intrinsic value and Weighted Average Cost of Capital.
- Editable Inputs: Yellow-highlighted cells for modifying revenue growth, tax rates, and discount rates.
- Financial Statements: Detailed annual and quarterly financial records for in-depth analysis.
- Key Ratios: Metrics on profitability, leverage, and efficiency for performance assessment.
- Dashboard and Charts: Visual representations of valuation outcomes and underlying assumptions.
Disclaimer
All information, articles, and product details provided on this website are for general informational and educational purposes only. We do not claim any ownership over, nor do we intend to infringe upon, any trademarks, copyrights, logos, brand names, or other intellectual property mentioned or depicted on this site. Such intellectual property remains the property of its respective owners, and any references here are made solely for identification or informational purposes, without implying any affiliation, endorsement, or partnership.
We make no representations or warranties, express or implied, regarding the accuracy, completeness, or suitability of any content or products presented. Nothing on this website should be construed as legal, tax, investment, financial, medical, or other professional advice. In addition, no part of this site—including articles or product references—constitutes a solicitation, recommendation, endorsement, advertisement, or offer to buy or sell any securities, franchises, or other financial instruments, particularly in jurisdictions where such activity would be unlawful.
All content is of a general nature and may not address the specific circumstances of any individual or entity. It is not a substitute for professional advice or services. Any actions you take based on the information provided here are strictly at your own risk. You accept full responsibility for any decisions or outcomes arising from your use of this website and agree to release us from any liability in connection with your use of, or reliance upon, the content or products found herein.