
|
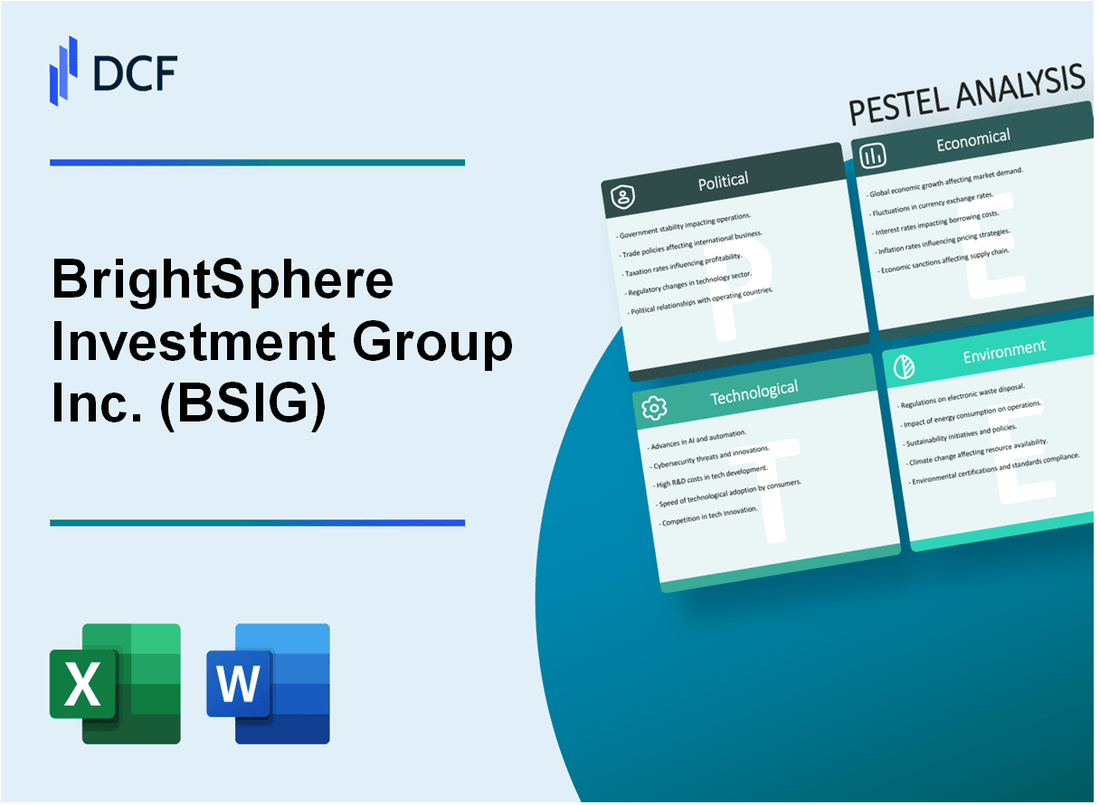
BrightSphere Investment Group Inc. (BSIG): PESTLE Analysis [Nov-2025 Updated] |
Fully Editable: Tailor To Your Needs In Excel Or Sheets
Professional Design: Trusted, Industry-Standard Templates
Investor-Approved Valuation Models
MAC/PC Compatible, Fully Unlocked
No Expertise Is Needed; Easy To Follow
BrightSphere Investment Group Inc. (BSIG) Bundle
You're looking for a clear map of the external forces shaping BrightSphere Investment Group Inc. (BSIG), and honestly, the landscape is shifting fast, especially in late 2025. The core challenge for BSIG, with its Assets Under Management (AUM) sitting near $160 billion, is navigating a dual threat: persistent fee compression putting pressure on margins and intense new regulatory scrutiny from the SEC. This environment means their projected 2025 net income of around $120 million is defintely at risk if they don't accelerate their tech adoption and meet the surging investor demand for Environmental, Social, and Governance (ESG) products. We need to look past the balance sheet to see where the real external risks and opportunities lie.
BrightSphere Investment Group Inc. (BSIG) - PESTLE Analysis: Political factors
Increased scrutiny from the US Securities and Exchange Commission (SEC) on private fund disclosures
The regulatory environment for asset managers like BrightSphere Investment Group Inc. (BSIG) is defined by heightened scrutiny from the US Securities and Exchange Commission (SEC), particularly concerning private funds and alternative investments. The SEC's 2025 examination priorities continue to focus on private fund advisers, demanding greater transparency on fees, expenses, and conflicts of interest. For registered investment advisers with over $1.5 billion in assets under management (AUM), the deadline for compliance with new rules, such as those requiring incident response programs for data breaches, is December 3, 2025.
This increased oversight, while costly for compliance, is a permanent shift. The SEC is specifically examining how managers disclose conflicts and allocate expenses, with a focus on preventing the charging of vague or excess fees to investors. Since BrightSphere's sole operating business, Acadian Asset Management, manages $151.1 billion in AUM as of June 30, 2025, and operates a sophisticated quantitative platform, ensuring all proprietary algorithms and data-driven strategies align with explicit fiduciary disclosures is a major, non-negotiable compliance project.
Potential changes to US corporate tax rates impacting net income, currently projected near $120 million for 2025.
The looming expiration of key provisions from the 2017 Tax Cuts and Jobs Act (TCJA) at the end of 2025 creates significant uncertainty for BrightSphere's future net income. The current statutory US corporate tax rate of 21% is not set to expire, but political proposals could change this dramatically. For instance, there are proposals to lower the corporate rate further, potentially to 15% for companies that manufacture domestically, or conversely, proposals to raise the rate to 28% to increase federal revenue.
Here's the quick math: Based on the analyst consensus for full-year 2025 Earnings Net Income per Share (ENI/sh) of $2.98 and approximately 37.318 million shares outstanding, the projected net income (ENI basis) is approximately $111.05 million. A shift in the corporate tax rate would directly impact this bottom line, changing the capital available for share repurchases or strategic investments.
What this estimate hides is the potential impact of other expiring provisions, such as the full expensing of research and development (R&D) costs, which could affect the tax liability of a technology-driven firm like Acadian Asset Management, Inc. (Acadian). The difference between a 21% and a 28% tax rate on a pre-tax income of, say, $140 million, is an annual tax expense swing of nearly $10 million. That's a defintely material swing.
Geopolitical tensions (e.g., US-China trade policy) affecting cross-border investment flows and client sentiment.
Geopolitical tensions, particularly the escalating US-China competition, pose a direct political risk to BrightSphere's global business. The company's client base is diverse, with 37% of its assets managed for clients outside of the U.S. as of March 31, 2025. This exposure is vulnerable to the increasing trade protectionism and 'active decoupling' between the two global powers.
The risk is two-fold:
- Client Sentiment: Global institutional investors may reduce allocations to US-based managers, or specifically to strategies with exposure to politically sensitive regions, due to increased uncertainty and the risk of sudden policy shifts.
- Regulatory Barriers: The Treasury Department's Outbound Investment Program, which went into effect on January 2, 2025, implements the first-ever restrictions on US capital being invested abroad in certain advanced technologies linked to China. This directly limits the investment universe and product offerings for Acadian's quantitative strategies that rely on global market access.
Furthermore, the threat of new tariffs, such as the proposed 10% to 25% tariffs on Chinese goods, signals a broader 'America First' policy that could destabilize global trade and financial markets, creating volatility that impacts both AUM and client risk appetite.
Regulatory stability around the Department of Labor's fiduciary rule for retirement advice.
The regulatory stability of the Department of Labor's (DOL) Retirement Security Rule (often called the Fiduciary Rule) remains in flux, creating a complex compliance landscape for any firm advising on retirement assets. A July 2025 court ruling significantly scaled back the DOL's expanded guidance, specifically determining that a single rollover recommendation does not automatically create fiduciary status under the Employee Retirement Income Security Act (ERISA).
This legal back-and-forth means the scope of fiduciary responsibility is still being defined, forcing asset managers to maintain dual compliance frameworks. Adding to the complexity, an August 2025 executive order charged the DOL with providing guidance to encourage defined contribution (DC) plan fiduciaries to offer greater exposure to 'alternative assets,' including private equity and digital currencies. This is a potential opportunity for BrightSphere, whose Acadian subsidiary focuses on sophisticated quantitative strategies, but it requires clear, new safe harbor guidance from the DOL to mitigate litigation risk for plan sponsors.
This table summarizes the immediate political risks and opportunities for the firm:
| Political Factor | Near-Term Risk (2025) | Near-Term Opportunity (2025) |
|---|---|---|
| SEC Scrutiny on Private Funds | Increased compliance costs; risk of enforcement actions for fee/conflict disclosure failures. | Compliance as a competitive advantage, attracting institutional investors seeking transparency. |
| US Corporate Tax Rate Changes | Potential tax rate increase to 28% could reduce projected net income (ENI basis) of ~$111.05 million. | Potential tax rate decrease (e.g., to 15%) could significantly boost after-tax profits and capital for buybacks. |
| Geopolitical Tensions (US-China) | Restrictions on outbound US capital investment (effective Jan 2, 2025); reduced cross-border client flows. | Increased demand for non-US-centric, diversified, and risk-managed global quantitative strategies. |
| DOL Fiduciary Rule | Uncertainty from court rulings (July 2025) requires maintaining complex, dual compliance standards. | August 2025 executive order encourages alternative assets in DC plans, opening a new market for Acadian's strategies. |
Finance: Track the tax reform debate and model the impact of a 28% and a 15% corporate tax rate on the $111.05 million projected ENI net income by the end of Q4 2025.
BrightSphere Investment Group Inc. (BSIG) - PESTLE Analysis: Economic factors
You're navigating an asset management landscape where macroeconomics is the primary driver of client behavior, not just a footnote. For BrightSphere Investment Group Inc., the economic factors in 2025 present a clear duality: a powerful tailwind from investor flight to systematic strategies, but a persistent headwind from fee pressure and market choppiness.
Persistent interest rate uncertainty driving demand for alternative and non-correlated assets, a BSIG strength.
The Federal Reserve's (the Fed) policy ambiguity and the resulting interest rate uncertainty have pushed institutional investors to seek 'alpha' (returns above a benchmark) outside of traditional 60/40 portfolios. This is a clear opportunity for BrightSphere Investment Group Inc. (BSIG), whose sole operating subsidiary, Acadian Asset Management, focuses on systematic, quantitative strategies that are often non-correlated to broad market swings.
The firm's success here is tangible: Q3 2025 saw net client cash flows (NCCF) of $6.4 billion, the second-highest quarterly inflow in the firm's history. This was largely driven by demand for their Enhanced and Extension strategies, which aim to deliver consistent, low-risk alpha. Honestly, this flight to non-correlated, systematic strategies is the biggest growth lever for the company right now.
Continued fee compression (lower investment management fees) putting pressure on the firm's operating margins.
Fee compression-the industry trend of lower investment management fees-is a reality for everyone, but BrightSphere Investment Group Inc. has managed to expand its margins by scaling its systematic platform. While the general pricing environment remains tough, the massive increase in Assets Under Management (AUM) is providing significant operating leverage.
Here's the quick math on profitability:
| Metric | Q3 2024 | Q3 2025 | Change |
|---|---|---|---|
| ENI Operating Margin | 31.7% | 33.2% | +157 basis points |
| Quarterly Management Fees | $112.1 million | $136.1 million | +21% |
The expansion of the Economic Net Income (ENI) operating margin by 157 basis points to 33.2% in Q3 2025 shows that the growth in recurring base management fees is more than offsetting the general pressure on fee rates. The firm is getting bigger faster than its fees are dropping.
Market volatility affecting performance fees and Assets Under Management (AUM), which sits near $160 billion.
Market volatility cuts both ways. On one hand, it drives clients toward systematic strategies like those offered by BrightSphere Investment Group Inc. for stability. On the other hand, it can make it harder to hit the high-water marks (the highest value an investment fund has reached) required to earn performance fees.
The firm's total AUM reached a record $166.4 billion as of September 30, 2025, a strong sign of market appreciation and positive net flows. But, the impact on the more volatile performance fee revenue is clear:
- Q3 2025 performance fees were just $0.2 million.
- This is a dramatic decline from the $10.1 million in performance fees reported in Q3 2024.
This drop highlights a key risk: while base management fees are robust, the variable, high-margin performance revenue stream is defintely susceptible to short-term market choppiness, even when the firm's long-term performance remains strong (with 94% of strategies by revenue outperforming their benchmarks over a 5-year period).
Inflationary pressures increasing operational costs for the firm's boutique affiliates.
The general inflationary environment in 2025, particularly around talent acquisition and technology, is a constant upward pressure on operational costs. For a firm like BrightSphere Investment Group Inc., which operates as a single, focused systematic manager (Acadian Asset Management), this translates directly into higher compensation and data expenses.
The firm has maintained strict expense discipline, however, which is why the ENI operating margin is expanding. Management expects the full fiscal year 2025 operating expense ratio to land between 44% and 46%, with a variable compensation ratio (a major component of cost) projected at 43% to 45%. This discipline is what keeps the margin expanding even as the cost of doing business rises. The firm is managing to keep its expense growth below its revenue growth.
BrightSphere Investment Group Inc. (BSIG) - PESTLE Analysis: Social factors
You need to see the social landscape not as a soft trend, but as a hard shift in capital. The next generation of investors is taking control of trillions, and their priorities-digital access and social impact-are non-negotiable. For a systematic manager like Acadian Asset Management Inc., which is the new focus of BrightSphere Investment Group Inc., this is a huge opportunity to deploy their data-driven model to meet these new, specific demands.
Accelerating shift of wealth to younger generations demanding digital access and socially responsible investing (SRI).
The Great Wealth Transfer is defintely the biggest social factor reshaping our industry. We're talking about an estimated $84 trillion in the U.S. alone that Baby Boomers and the Silent Generation will pass down to Millennials and Gen Z by 2045.
This isn't just a balance sheet change; it's a total shift in client expectation. The new high-net-worth individuals (HNWIs) demand a digital-first, hyperpersonalized experience, not the quarterly paper statement their parents got. They are also highly mobile, so they need seamless communication and transparency. Honestly, this is why up to 90% of heirs often leave their parents' wealth manager-the old firms just don't connect with them.
Acadian Asset Management Inc., with its systematic, technology-heavy approach, is well-positioned to build the digital platforms and data-driven insights these clients expect. It's a technology race, and the younger generation is the finish line.
Strong investor preference for Environmental, Social, and Governance (ESG) products, requiring new fund launches.
The demand for Environmental, Social, and Governance (ESG) investing is no longer a niche market; it's a core investment thesis. The global ESG investing market is valued at $35.48 trillion in 2025, and the U.S. market is projected to grow at a Compound Annual Growth Rate (CAGR) of 19.04% from 2025 to 2034.
This preference is strongest with younger investors: a stunning 96% of Millennials express interest in sustainable options. This means firms like Acadian Asset Management Inc. must not only offer ESG products but integrate ESG data directly into their systematic models. For example, ESG integration is already the most common sustainable investing strategy, used by 81% of market assets.
Here is a quick look at the scale of the commitment:
| Metric | Value (As of 2025) | Source |
|---|---|---|
| Global ESG Investing Market Value | $35.48 trillion | |
| US ESG Mutual Fund/ETF Assets (Sept 2025) | $617.44 billion | |
| Millennials Interested in Sustainable Options | 96% | |
| Acadian's Net Impact Ratio | 25.0% (Overall Positive) |
Demographic trends driving increased demand for retirement and wealth preservation solutions.
The U.S. retirement market is massive, holding roughly $36 trillion in assets as of 2024. But the dynamics are changing fast. The Defined Contribution (DC) system is now in a 'decumulation phase,' meaning Baby Boomer withdrawals are starting to outpace younger savers' contributions. This trend will intensify as the number of Americans turning 65 is projected to peak in 2026-2027.
So, the focus shifts from just accumulation to guaranteed income. We are seeing a surge in demand for retirement income solutions, like hybrid default solutions that combine Target Date Funds with guaranteed income products. Plus, employers are getting involved: 92% of them plan to prioritize financial wellness programs in 2025, signaling a huge opportunity for firms that can provide these robust, personalized solutions.
Growing public distrust in traditional financial institutions pushing clients toward independent advisors.
Public trust in the big banks and traditional financial institutions continues to erode, creating a strong tailwind for independent advisors and specialist managers. The independent trust industry, for instance, is gaining prominence as a preferred alternative to the bank trust departments.
Clients want a fiduciary relationship, not a sales relationship. This is why the Registered Investment Advisor (RIA) segment is so powerful, with RIAs collectively managing over $125 trillion in assets. Independent advisors are focused on scaling their practices to capture this demand:
- 70% of financial advisors emphasize organic growth.
- 78% cite generating leads and referrals as their biggest roadblock.
- Independent practices that centralize portfolio management see a 16% increase in advisor productivity.
Acadian Asset Management Inc.'s systematic, institutional-quality strategies are an attractive offering for these independent advisors who need sophisticated, high-performing products to differentiate themselves and serve their clients effectively.
BrightSphere Investment Group Inc. (BSIG) - PESTLE Analysis: Technological factors
You're analyzing BrightSphere Investment Group Inc. (BSIG), which, as of January 1, 2025, operates as the singularly focused systematic manager, Acadian Asset Management Inc. (AAMI). The technology factor here isn't just a support function; it is the core product. Their entire business model-quantitative investment strategies-is a technology play. The near-term risks and opportunities center on scaling their data processing capabilities and maintaining an ironclad defense against cyber threats.
Rapid adoption of Artificial Intelligence (AI) and machine learning to refine quantitative investment strategies.
Acadian Asset Management's competitive advantage is explicitly tied to its systematic, data-driven approach, which is essentially a sophisticated application of machine learning and quantitative modeling. This isn't a firm exploring AI; they are a firm built on it. Their success in generating alpha (excess returns) depends on continuously refining these models faster than the competition. For the fiscal year 2025, their systematic process delivered a 4.4% annualized excess return over a five-year period for their strategies, revenue-weighted, as of Q1 2025. That's a clear, quantifiable return on their technology investment.
The entire asset management industry is shifting toward Generative AI (GenAI), with 95% of firms scaling its adoption to multiple use cases in early 2025. Acadian Asset Management must move from traditional machine learning to exploring agentic AI to maintain its edge. Honestly, their biggest risk is complacency, not adoption.
Use of big data analytics to identify alpha (excess returns) sources in increasingly complex markets.
The sheer scale of data Acadian Asset Management processes illustrates their reliance on big data analytics. The ability to ingest, clean, and model this massive, unstructured data is what allows their 120+ person investment team, many with advanced analytic degrees, to find new alpha sources. This capability is what drives their strong performance and is a key factor in their operational efficiency, contributing to an expected full-year 2025 operating expense ratio of approximately 45% to 47%.
Here's the quick math on their data scale, which is the engine of their systematic strategies:
| Metric | Value (as of 2025) | Significance |
|---|---|---|
| Assets Under Management (AUM) | Approximately $166 billion (Sep 30, 2025) | Scale of capital relying on data analytics. |
| Traded Assets | 65,000+ | Breadth of the investment universe analyzed by models. |
| Total Data Processed | 61+ terabytes | Volume of proprietary and alternative data used. |
| Daily Observations | 620+ million | The real-time feed for model inputs and trading signals. |
Critical need for enhanced cybersecurity defenses against sophisticated attacks targeting client data and firm assets.
As a systematic firm, Acadian Asset Management is a prime target. Their intellectual property-the proprietary quantitative models-is their most valuable asset, plus they hold $166 billion in client assets. A breach of their models or client data would be catastrophic, so cybersecurity is paramount.
The firm allocates substantial resources to this defense, led by a dedicated Director of Information Security. They don't just put up a firewall; they actively test their own systems. This is defintely a necessary cost of doing business in the modern financial world.
- Conduct live tests using professional "hacker" services.
- Employ vulnerability assessment tools.
- Use secure configurations and web content filtering for intrusion prevention.
- Prioritize risk management, mirroring the 44% of IT buyers who graded it a major priority in 2025.
Digital transformation of client onboarding and reporting to meet investor expectations for real-time data access.
Institutional investors, Acadian Asset Management's primary client base, expect seamless, real-time access to performance and risk data. While the firm is systematic in its investment process, its client-facing technology must match this sophistication. The digital transformation here focuses on providing analytical clarity and transparency to institutional clients who are invested across multiple strategies.
The firm's Investor Relations platform acts as the central hub, routinely posting information important to investors, including financial and operating results like the Q1 2025 ENI diluted EPS of $0.54 per share. The key action is to convert their massive data processing capability into digestible, customized, and secure digital reports for clients, helping to drive client retention and growth. They need to ensure that the client experience is as high-tech as the investment engine.
Acadian Asset Management Inc. (AAMI) - PESTLE Analysis: Legal factors
New SEC rules on investment adviser custody and outsourcing creating compliance burdens and costs.
You're operating a systematic investment manager like Acadian Asset Management Inc. (AAMI) in a period of intense regulatory overhaul, and the Securities and Exchange Commission (SEC) is driving the change. The new rules on safeguarding client assets (the proposed overhaul of the Custody Rule) and investment adviser outsourcing are the primary near-term compliance headaches. The proposed Safeguarding Rule is a massive expansion, moving beyond just client funds and securities to cover virtually all client assets, including private debt, real estate, and digital assets.
What's more, the SEC is explicitly including a discretionary trading authority as conferring custody, which forces AAMI to adopt new, more stringent custodial arrangements and written agreements with qualified custodians. The new Outsourcing Rule, expected to be finalized, requires a formal due diligence process and continuous monitoring of third-party service providers. This isn't just a legal check-box; it's a significant operational and cost burden. For a firm with $166.4 billion in Assets Under Management (AUM) as of September 30, 2025, the cost of implementing new technology and legal frameworks to meet these standards is substantial.
Here's the quick math on the compliance pressure: while AAMI's full-year 2025 operating expense ratio is expected to be approximately 44-46% of management fees, a significant portion of that non-compensation expense is now being driven by regulatory technology and legal counsel to comply with these new mandates. The industry is seeing enforcement, with one RIA settling a Custody Rule violation for a $50,000 civil penalty in September 2025 alone, showing the SEC is serious.
Evolving global data privacy regulations (like the EU's General Data Protection Regulation) complicating client data management.
Acadian Asset Management Inc. operates globally, with approximately 37% of its assets managed for clients outside the U.S. as of Q1 2025. This global footprint means the firm is caught between the U.S. federal and state rules (like the California Consumer Privacy Act, or CCPA) and international standards like the European Union's General Data Protection Regulation (GDPR). Honestly, managing client data across these jurisdictions is a nightmare of conflicting requirements.
The risk here is not just the compliance cost, but the cost of non-compliance. The global average cost of a data breach is estimated to be $4.4 million in 2025, a number that rises sharply when regulatory non-compliance is a factor. We're talking about fines that hit the bottom line directly and immediately.
The table below illustrates the financial risk of non-compliance, which is a clear and present danger for any asset manager with a global client base:
| Regulation | Maximum Penalty/Cost Metric | 2025 Relevance |
|---|---|---|
| GDPR (EU) | Up to €20 million or 4% of global annual revenue (whichever is higher) | Average 2024 fine was €2.8 million, up 30% from the prior year. |
| CCPA/CPRA (California) | Up to $7,500 per intentional violation/incident (no cap on total penalty) | Applies to firms with over $25 million in annual gross revenue. |
| Data Breach (Global Average) | $4.4 million per data breach event | AAMI's risk disclosure cites potential 'regulatory penalties and financial losses' from security breaches. |
Increased litigation risk related to investment performance and disclosure practices.
The regulatory environment is turning up the heat on investment performance and disclosure. When markets get volatile, clients look for someone to blame, and that often means litigation against the investment adviser. The SEC's enforcement focus in its 2025 fiscal year has included actions against advisers for conflicts of interest disclosures, Marketing Rule violations, and misrepresentations. For AAMI, whose systematic strategies rely heavily on data and technology, the risk of litigation or regulatory action tied to the transparency and accuracy of its quantitative models is particularly acute.
While AAMI's strong performance-with over 94% of strategies by revenue beating their benchmarks over the 3-, 5-, and 10-year periods as of Q1 2025-mitigates some performance-related risk, the bar for disclosure is constantly rising. Enforcement actions against other firms have resulted in penalties as high as $90 million for multiple charges, demonstrating the scale of financial risk. The firm must defintely ensure its disclosures, especially for newer strategies like enhanced equity and systematic credit, are rock-solid and in plain English.
Stricter anti-money laundering (AML) and know-your-customer (KYC) requirements raising compliance expenses.
The global push for financial transparency continues to tighten the screws on Anti-Money Laundering (AML) and Know-Your-Customer (KYC) requirements. For a firm with a global institutional client base, this translates directly into higher operational costs. The demand for compliance and regulatory software surged by 22.3% in 2025, particularly in North America and Europe, driven by these enhanced AML/KYC mandates.
The complexity of verifying beneficial ownership across different international legal structures means AAMI must invest more in dedicated compliance personnel and automated systems. This is a non-negotiable cost of doing business internationally. To be fair, industry extrapolations suggest that large asset managers (over $10 billion AUM) were already spending upwards of $14 million annually on compliance, and that figure is only increasing in 2025 due to the confluence of AML/KYC, data privacy, and new SEC rules.
The key action here is to allocate capital to RegTech (Regulatory Technology) solutions to automate the identity verification and transaction monitoring processes. You need to start using AI for fraud detection, as 36% of executives are already doing, to manage this rising expense.
BrightSphere Investment Group Inc. (BSIG) - PESTLE Analysis: Environmental factors
Mandatory climate-risk disclosure requirements for public companies, impacting portfolio company analysis.
You might think the US Securities and Exchange Commission (SEC) climate disclosure rule, which was set to start for large accelerated filers like BrightSphere Investment Group Inc. (soon to be Acadian Asset Management Inc.) with their December 31, 2025, annual reports, is a done deal. But honestly, it's not that simple. The rule has been subject to a voluntary stay and litigation abeyance since September 2025, meaning the federal mandate is paused for now.
Still, the pressure is real. Acadian Asset Management Inc., as a global systematic manager, still faces mandatory reporting under other regimes. For instance, if they have significant operations or clients in the European Union, the Corporate Sustainability Reporting Directive (CSRD) and the EU Taxonomy are already in play. Plus, California's state-level climate disclosure laws (SB 253 and SB 261) are moving forward.
This means the firm's quantitative models must rapidly integrate new, standardized climate data-or the lack thereof-for all portfolio companies, regardless of the SEC's delay. The systematic approach is actually an advantage here; they are built to process vast, complex datasets, but the data quality is the limit. What this estimate hides is the cost of sourcing and normalizing this non-financial data for thousands of global stocks and bonds.
Growing pressure from institutional clients to integrate climate change and sustainability metrics into investment decisions.
The biggest driver isn't regulation; it's your clients. Institutional investors-pension funds, endowments, and sovereign wealth funds-are making climate strategy a core part of their fiduciary duty. A recent Mercer study found that 70% of large asset owners, who collectively manage over $2 trillion in assets, now integrate responsible investment goals into their strategies, a seven percentage point jump in one year.
This translates directly into demands on asset managers like Acadian Asset Management Inc. They need to show precisely how their systematic strategies account for both physical risks (like extreme weather destroying assets) and transition risks (like a sudden carbon tax). For a firm that had $121.9 billion in Assets Under Management (AUM) as of March 31, 2025, and saw $3.8 billion in positive net flows in Q1 2025, responding to this client demand is crucial for maintaining growth.
Here's the quick math: if you lose even 5% of that AUM due to a perceived lack of climate integration, you're talking about a loss of over $6 billion in assets. It's a commercial imperative.
Increased demand for funds aligned with the Paris Agreement and net-zero carbon goals.
The market is clearly shifting capital. The global trend is towards net-zero. About 86% of asset owners and 74% of asset managers are setting net-zero by 2050 targets. This isn't just talk; it's a massive reallocation of capital. Global investment in clean energy is projected to hit about $2.2 trillion in 2025, which is roughly double the spending on fossil fuels.
Acadian Asset Management Inc. needs to offer products that map directly to these client goals, especially given their quantitative strength. This means developing and marketing systematic strategies that target lower-carbon intensity, green bonds, or climate solutions. The total sustainable fund assets climbed to $3.7 trillion in 2025, so the opportunity is defintely there.
The firm's systematic approach should allow for rapid product innovation in this space, using data to create highly customized, low-tracking-error portfolios that meet specific net-zero alignment criteria for large institutional mandates.
Reputational risks tied to investments in carbon-intensive sectors, influencing capital flows.
Reputation is currency in asset management, and being linked to high-carbon sectors carries significant risk. While the overall capital flow is moving toward clean energy, there is still a massive amount of financing going to fossil fuels. For example, the world's largest banks financed fossil-fuel companies to the tune of some $162 billion in 2024, for a total exposure of about $869 billion.
Acadian Asset Management Inc. must manage the perception of its underlying holdings. The risk is not just financial; it's reputational, which can trigger rapid client redemptions. European investors, for instance, are already reassessing their exposure to US asset managers who they feel are wavering on climate commitments.
The firm's quantitative models are uniquely positioned to manage this risk by systematically underweighting or excluding companies based on their carbon intensity and transition readiness, which is a far more precise method than traditional qualitative screening.
| Environmental Macro-Trend | 2025 Key Metric/Value | Impact on Acadian Asset Management Inc. (BSIG) |
|---|---|---|
| Global Clean Energy Investment | Projected $2.2 trillion in 2025 (double fossil fuel spending) | Opportunity to capture new AUM via systematic strategies focused on clean energy and transition finance. |
| Institutional Investor Integration | 70% of large asset owners integrate responsible investment goals | Mandatory requirement to embed climate metrics (TCFD, etc.) into all investment models to retain and win institutional mandates. |
| SEC Disclosure Rule Status | Compliance for large filers set for Dec 2025 annual reports, but rule is currently under a legal stay | Reduced immediate US federal compliance cost, but continued pressure from state (CA) and international (EU CSRD) laws. |
| Sustainable Fund Assets (Global) | Total sustainable fund assets reached $3.7 trillion in 2025 | Validates the market size for ESG-aligned products; necessitates product development to align with net-zero targets. |
Disclaimer
All information, articles, and product details provided on this website are for general informational and educational purposes only. We do not claim any ownership over, nor do we intend to infringe upon, any trademarks, copyrights, logos, brand names, or other intellectual property mentioned or depicted on this site. Such intellectual property remains the property of its respective owners, and any references here are made solely for identification or informational purposes, without implying any affiliation, endorsement, or partnership.
We make no representations or warranties, express or implied, regarding the accuracy, completeness, or suitability of any content or products presented. Nothing on this website should be construed as legal, tax, investment, financial, medical, or other professional advice. In addition, no part of this site—including articles or product references—constitutes a solicitation, recommendation, endorsement, advertisement, or offer to buy or sell any securities, franchises, or other financial instruments, particularly in jurisdictions where such activity would be unlawful.
All content is of a general nature and may not address the specific circumstances of any individual or entity. It is not a substitute for professional advice or services. Any actions you take based on the information provided here are strictly at your own risk. You accept full responsibility for any decisions or outcomes arising from your use of this website and agree to release us from any liability in connection with your use of, or reliance upon, the content or products found herein.