
|
Peabody Energy Corporation (BTU) DCF Valuation |
Fully Editable: Tailor To Your Needs In Excel Or Sheets
Professional Design: Trusted, Industry-Standard Templates
Investor-Approved Valuation Models
MAC/PC Compatible, Fully Unlocked
No Expertise Is Needed; Easy To Follow
Peabody Energy Corporation (BTU) Bundle
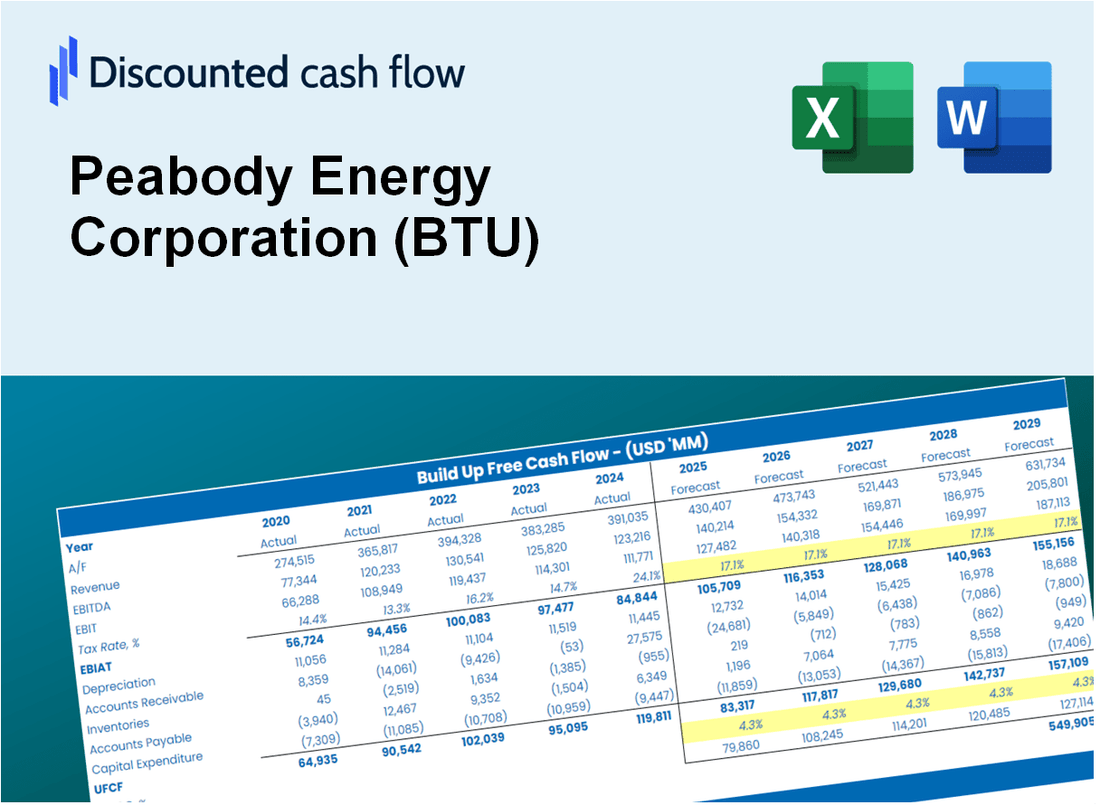
Whether you’re an investor or analyst, this BTU DCF Calculator is your go-to resource for accurate valuation. Preloaded with Peabody Energy Corporation’s real data, you can adjust forecasts and observe the effects in real-time.
Discounted Cash Flow (DCF) - (USD MM)
| Year | AY1 2020 |
AY2 2021 |
AY3 2022 |
AY4 2023 |
AY5 2024 |
FY1 2025 |
FY2 2026 |
FY3 2027 |
FY4 2028 |
FY5 2029 |
|---|---|---|---|---|---|---|---|---|---|---|
| Revenue | 2,881.1 | 3,318.3 | 4,981.9 | 4,946.7 | 4,236.7 | 4,768.9 | 5,368.0 | 6,042.4 | 6,801.4 | 7,655.8 |
| Revenue Growth, % | 0 | 15.17 | 50.13 | -0.70656 | -14.35 | 12.56 | 12.56 | 12.56 | 12.56 | 12.56 |
| EBITDA | -1,320.3 | 907.0 | 1,785.9 | 1,506.0 | 954.9 | 670.9 | 755.2 | 850.0 | 956.8 | 1,077.0 |
| EBITDA, % | -45.83 | 27.33 | 35.85 | 30.44 | 22.54 | 14.07 | 14.07 | 14.07 | 14.07 | 14.07 |
| Depreciation | 391.7 | 353.4 | 367.0 | 321.4 | 391.9 | 451.7 | 508.5 | 572.3 | 644.2 | 725.2 |
| Depreciation, % | 13.6 | 10.65 | 7.37 | 6.5 | 9.25 | 9.47 | 9.47 | 9.47 | 9.47 | 9.47 |
| EBIT | -1,712.0 | 553.6 | 1,418.9 | 1,184.6 | 563.0 | 219.2 | 246.7 | 277.7 | 312.6 | 351.8 |
| EBIT, % | -59.42 | 16.68 | 28.48 | 23.95 | 13.29 | 4.6 | 4.6 | 4.6 | 4.6 | 4.6 |
| Total Cash | 709.2 | 954.3 | 1,307.3 | 969.3 | 700.4 | 1,103.9 | 1,242.6 | 1,398.7 | 1,574.4 | 1,772.2 |
| Total Cash, percent | .0 | .0 | .0 | .0 | .0 | .0 | .0 | .0 | .0 | .0 |
| Account Receivables | 244.8 | 350.5 | 465.5 | 389.7 | 359.3 | 426.9 | 480.6 | 540.9 | 608.9 | 685.4 |
| Account Receivables, % | 8.5 | 10.56 | 9.34 | 7.88 | 8.48 | 8.95 | 8.95 | 8.95 | 8.95 | 8.95 |
| Inventories | 261.6 | 226.7 | 296.1 | 351.8 | 393.4 | 364.8 | 410.7 | 462.3 | 520.3 | 585.7 |
| Inventories, % | 9.08 | 6.83 | 5.94 | 7.11 | 9.29 | 7.65 | 7.65 | 7.65 | 7.65 | 7.65 |
| Accounts Payable | 146.3 | 201.7 | 240.7 | 275.8 | 228.4 | 257.1 | 289.4 | 325.7 | 366.7 | 412.7 |
| Accounts Payable, % | 5.08 | 6.08 | 4.83 | 5.58 | 5.39 | 5.39 | 5.39 | 5.39 | 5.39 | 5.39 |
| Capital Expenditure | -197.5 | -183.1 | -224.2 | -348.3 | -402.5 | -318.7 | -358.7 | -403.8 | -454.5 | -511.6 |
| Capital Expenditure, % | -6.86 | -5.52 | -4.5 | -7.04 | -9.5 | -6.68 | -6.68 | -6.68 | -6.68 | -6.68 |
| Tax Rate, % | 28.13 | 28.13 | 28.13 | 28.13 | 28.13 | 28.13 | 28.13 | 28.13 | 28.13 | 28.13 |
| EBITAT | -1,729.1 | 538.5 | 1,439.4 | 800.0 | 404.6 | 191.4 | 215.5 | 242.5 | 273.0 | 307.3 |
| Depreciation | ||||||||||
| Changes in Account Receivables | ||||||||||
| Changes in Inventories | ||||||||||
| Changes in Accounts Payable | ||||||||||
| Capital Expenditure | ||||||||||
| UFCF | -1,895.0 | 693.4 | 1,436.8 | 828.3 | 335.4 | 314.0 | 298.0 | 335.4 | 377.6 | 425.0 |
| WACC, % | 6.75 | 6.73 | 6.75 | 6.42 | 6.46 | 6.62 | 6.62 | 6.62 | 6.62 | 6.62 |
| PV UFCF | ||||||||||
| SUM PV UFCF | 1,433.9 | |||||||||
| Long Term Growth Rate, % | 0.50 | |||||||||
| Free cash flow (T + 1) | 427 | |||||||||
| Terminal Value | 6,976 | |||||||||
| Present Terminal Value | 5,062 | |||||||||
| Enterprise Value | 6,496 | |||||||||
| Net Debt | -233 | |||||||||
| Equity Value | 6,729 | |||||||||
| Diluted Shares Outstanding, MM | 142 | |||||||||
| Equity Value Per Share | 47.42 |
What You Will Get
- Editable Excel Template: A fully customizable Excel-based DCF Calculator featuring pre-filled real BTU financials.
- Real-World Data: Historical data and projected estimates (as indicated in the highlighted cells).
- Forecast Flexibility: Adjust forecast parameters such as revenue growth, EBITDA %, and WACC.
- Automatic Calculations: Instantly observe how your inputs affect Peabody Energy's valuation.
- Professional Tool: Designed for investors, CFOs, consultants, and financial analysts.
- User-Friendly Design: Organized for clarity and simplicity, complete with step-by-step guidance.
Key Features
- Comprehensive Peabody Financials: Access reliable pre-loaded historical data and future projections for Peabody Energy Corporation (BTU).
- Customizable Forecast Assumptions: Modify highlighted cells such as WACC, growth rates, and profit margins to suit your analysis.
- Dynamic Calculations: Automatic updates for DCF, Net Present Value (NPV), and cash flow assessments.
- Visual Dashboard: User-friendly charts and summaries to effectively visualize your valuation outcomes.
- For Professionals and Beginners: A straightforward, intuitive layout designed for investors, CFOs, and consultants alike.
How It Works
- Download: Obtain the pre-formatted Excel file featuring Peabody Energy Corporation’s (BTU) financial data.
- Customize: Modify projections, including revenue growth, EBITDA %, and WACC.
- Update Automatically: The intrinsic value and NPV calculations refresh in real-time.
- Test Scenarios: Generate various forecasts and instantly compare the results.
- Make Decisions: Leverage the valuation outcomes to inform your investment approach.
Why Choose Peabody Energy's Calculator?
- Save Time: Skip the hassle of building a DCF model from the ground up – it’s ready for immediate use.
- Improve Accuracy: Dependable financial data and formulas minimize valuation errors.
- Fully Customizable: Adjust the model to align with your specific assumptions and forecasts.
- Easy to Interpret: Intuitive charts and outputs simplify the analysis of results.
- Trusted by Experts: Crafted for professionals who prioritize accuracy and ease of use.
Who Should Use This Product?
- Investors: Make informed decisions with a comprehensive analysis tool for Peabody Energy Corporation (BTU).
- Financial Analysts: Streamline your workflow with a customizable financial model tailored for Peabody Energy Corporation (BTU).
- Consultants: Effortlessly modify the template for client pitches or reports related to Peabody Energy Corporation (BTU).
- Energy Sector Enthusiasts: Enhance your grasp of industry valuation methods through practical examples from Peabody Energy Corporation (BTU).
- Educators and Students: Utilize it as a hands-on learning resource in energy finance courses.
What the Template Contains
- Historical Data: Includes Peabody Energy Corporation’s past financials and baseline forecasts.
- DCF and Levered DCF Models: Detailed templates to calculate Peabody Energy Corporation’s intrinsic value.
- WACC Sheet: Pre-built calculations for Weighted Average Cost of Capital.
- Editable Inputs: Modify key drivers like growth rates, EBITDA %, and CAPEX assumptions.
- Quarterly and Annual Statements: A complete breakdown of Peabody Energy Corporation’s financials.
- Interactive Dashboard: Visualize valuation results and projections dynamically.
Disclaimer
All information, articles, and product details provided on this website are for general informational and educational purposes only. We do not claim any ownership over, nor do we intend to infringe upon, any trademarks, copyrights, logos, brand names, or other intellectual property mentioned or depicted on this site. Such intellectual property remains the property of its respective owners, and any references here are made solely for identification or informational purposes, without implying any affiliation, endorsement, or partnership.
We make no representations or warranties, express or implied, regarding the accuracy, completeness, or suitability of any content or products presented. Nothing on this website should be construed as legal, tax, investment, financial, medical, or other professional advice. In addition, no part of this site—including articles or product references—constitutes a solicitation, recommendation, endorsement, advertisement, or offer to buy or sell any securities, franchises, or other financial instruments, particularly in jurisdictions where such activity would be unlawful.
All content is of a general nature and may not address the specific circumstances of any individual or entity. It is not a substitute for professional advice or services. Any actions you take based on the information provided here are strictly at your own risk. You accept full responsibility for any decisions or outcomes arising from your use of this website and agree to release us from any liability in connection with your use of, or reliance upon, the content or products found herein.