
|
Citigroup Inc. (C) DCF Valuation |
Fully Editable: Tailor To Your Needs In Excel Or Sheets
Professional Design: Trusted, Industry-Standard Templates
Investor-Approved Valuation Models
MAC/PC Compatible, Fully Unlocked
No Expertise Is Needed; Easy To Follow
Citigroup Inc. (C) Bundle
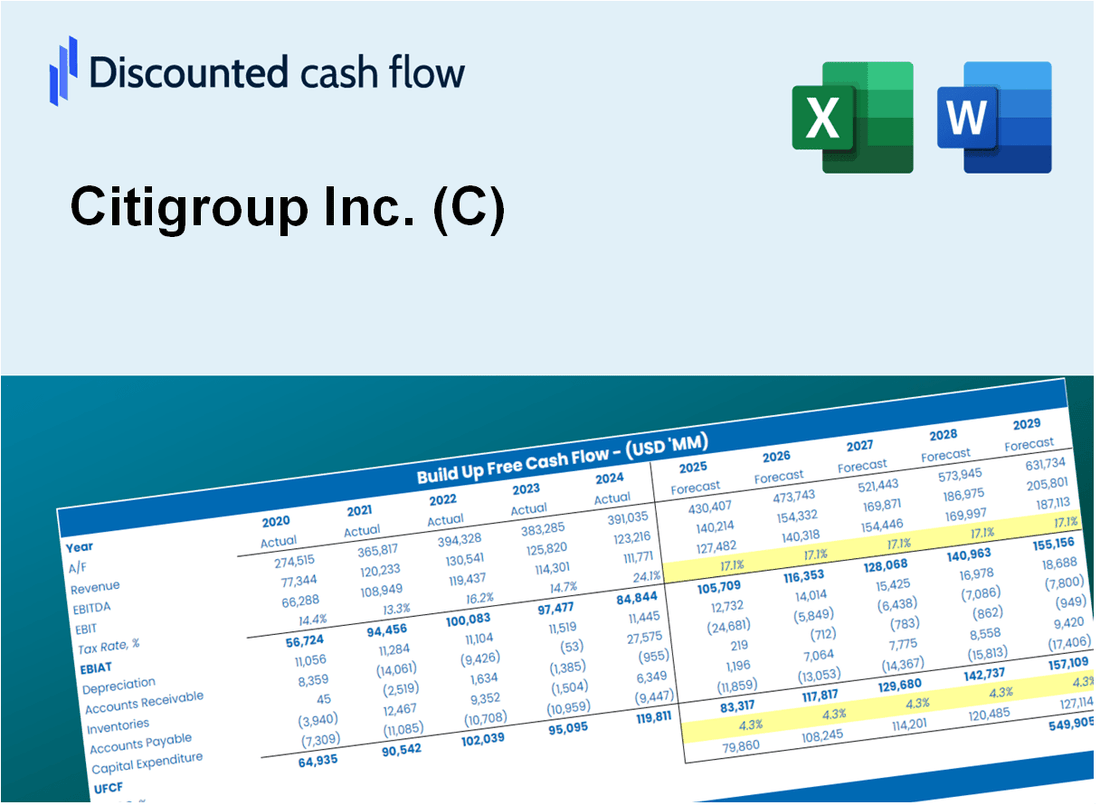
Whether you're an investor or analyst, this (C) DCF Calculator is your go-to resource for accurate valuation. Equipped with real data from Citigroup Inc., you can adjust forecasts and instantly observe the effects.
What You Will Get
- Real C Financials: Access to historical and projected data for precise valuation.
- Customizable Inputs: Adjust WACC, tax rates, revenue growth, and capital expenditures as needed.
- Dynamic Calculations: Intrinsic value and NPV are computed automatically.
- Scenario Analysis: Evaluate various scenarios to assess Citigroup's future performance.
- User-Friendly Design: Designed for finance professionals while remaining accessible to newcomers.
Key Features
- 🔍 Real-Life C Financials: Pre-filled historical and projected data for Citigroup Inc.
- ✏️ Fully Customizable Inputs: Adjust all critical parameters (yellow cells) like WACC, growth %, and tax rates.
- 📊 Professional DCF Valuation: Built-in formulas calculate Citigroup’s intrinsic value using the Discounted Cash Flow method.
- ⚡ Instant Results: Visualize Citigroup’s valuation instantly after making changes.
- Scenario Analysis: Test and compare outcomes for various financial assumptions side-by-side.
How It Works
- Step 1: Download the Excel file.
- Step 2: Review pre-entered Citigroup Inc. (C) data (historical and projected).
- Step 3: Adjust key assumptions (yellow cells) based on your analysis.
- Step 4: View automatic recalculations for Citigroup Inc. (C)’s intrinsic value.
- Step 5: Use the outputs for investment decisions or reporting.
Why Choose This Calculator for Citigroup Inc. (C)?
- Designed for Experts: A sophisticated tool utilized by financial analysts, investment managers, and corporate strategists.
- Comprehensive Data: Citigroup’s historical and projected financials preloaded for precise analysis.
- Flexible Scenario Analysis: Effortlessly test various forecasts and assumptions.
- Insightful Outputs: Automatically computes intrinsic value, NPV, and essential financial metrics.
- User-Friendly: Step-by-step guidance ensures a smooth experience throughout the process.
Who Should Use This Product?
- Individual Investors: Gain insights for making informed decisions on buying or selling Citigroup Inc. (C) stock.
- Financial Analysts: Enhance valuation assessments with comprehensive financial models tailored for Citigroup Inc. (C).
- Consultants: Provide clients with accurate valuation insights related to Citigroup Inc. (C) efficiently.
- Business Owners: Learn about the valuation methods of major financial institutions like Citigroup Inc. (C) to inform your own business strategies.
- Finance Students: Explore valuation techniques using real-world data and case studies from Citigroup Inc. (C).
What the Template Contains
- Operating and Balance Sheet Data: Pre-filled Citigroup Inc. (C) historical data and forecasts, including revenue, EBITDA, EBIT, and capital expenditures.
- WACC Calculation: A dedicated sheet for Weighted Average Cost of Capital (WACC), including parameters like Beta, risk-free rate, and share price.
- DCF Valuation (Unlevered and Levered): Editable Discounted Cash Flow models showing intrinsic value with detailed calculations.
- Financial Statements: Pre-loaded financial statements (annual and quarterly) to support analysis.
- Key Ratios: Includes profitability, leverage, and efficiency ratios for Citigroup Inc. (C).
- Dashboard and Charts: Visual summary of valuation outputs and assumptions to analyze results easily.
Disclaimer
All information, articles, and product details provided on this website are for general informational and educational purposes only. We do not claim any ownership over, nor do we intend to infringe upon, any trademarks, copyrights, logos, brand names, or other intellectual property mentioned or depicted on this site. Such intellectual property remains the property of its respective owners, and any references here are made solely for identification or informational purposes, without implying any affiliation, endorsement, or partnership.
We make no representations or warranties, express or implied, regarding the accuracy, completeness, or suitability of any content or products presented. Nothing on this website should be construed as legal, tax, investment, financial, medical, or other professional advice. In addition, no part of this site—including articles or product references—constitutes a solicitation, recommendation, endorsement, advertisement, or offer to buy or sell any securities, franchises, or other financial instruments, particularly in jurisdictions where such activity would be unlawful.
All content is of a general nature and may not address the specific circumstances of any individual or entity. It is not a substitute for professional advice or services. Any actions you take based on the information provided here are strictly at your own risk. You accept full responsibility for any decisions or outcomes arising from your use of this website and agree to release us from any liability in connection with your use of, or reliance upon, the content or products found herein.