
|
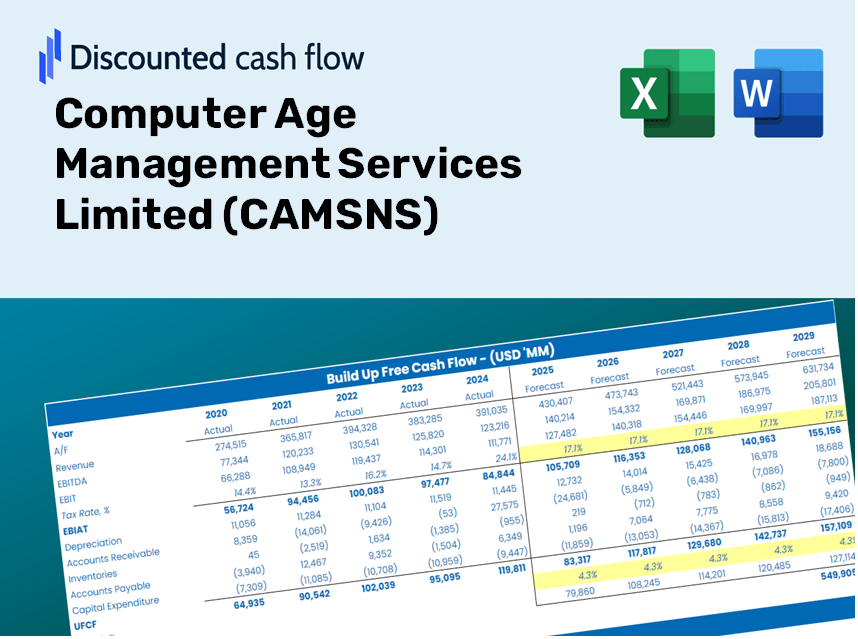
Computer Age Management Services Limited (CAMS.NS) DCF Valuation |
Fully Editable: Tailor To Your Needs In Excel Or Sheets
Professional Design: Trusted, Industry-Standard Templates
Investor-Approved Valuation Models
MAC/PC Compatible, Fully Unlocked
No Expertise Is Needed; Easy To Follow
Computer Age Management Services Limited (CAMS.NS) Bundle
Evaluate the financial outlook of Computer Age Management Services Limited (CAMSNS) like an expert! This (CAMSNS) DCF Calculator provides you with pre-filled financial data and the flexibility to customize revenue growth, WACC, margins, and other essential assumptions to align with your predictions.
Discounted Cash Flow (DCF) - (USD MM)
| Year | AY1 2021 |
AY2 2022 |
AY3 2023 |
AY4 2024 |
AY5 2025 |
FY1 2026 |
FY2 2027 |
FY3 2028 |
FY4 2029 |
FY5 2030 |
|---|---|---|---|---|---|---|---|---|---|---|
| Revenue | 7,055.0 | 9,096.7 | 9,718.3 | 11,365.2 | 14,224.8 | 16,994.5 | 20,303.3 | 24,256.5 | 28,979.3 | 34,621.7 |
| Revenue Growth, % | 0 | 28.94 | 6.83 | 16.95 | 25.16 | 19.47 | 19.47 | 19.47 | 19.47 | 19.47 |
| EBITDA | 2,683.7 | 3,944.5 | 3,862.7 | 4,781.4 | 6,230.9 | 7,036.4 | 8,406.5 | 10,043.2 | 11,998.7 | 14,334.9 |
| EBITDA, % | 38.04 | 43.36 | 39.75 | 42.07 | 43.8 | 41.4 | 41.4 | 41.4 | 41.4 | 41.4 |
| Depreciation | 151.2 | 218.0 | 252.3 | 436.0 | 483.7 | 488.5 | 583.6 | 697.3 | 833.0 | 995.2 |
| Depreciation, % | 2.14 | 2.4 | 2.6 | 3.84 | 3.4 | 2.87 | 2.87 | 2.87 | 2.87 | 2.87 |
| EBIT | 2,532.4 | 3,726.5 | 3,610.4 | 4,345.4 | 5,747.2 | 6,547.9 | 7,822.8 | 9,346.0 | 11,165.6 | 13,339.6 |
| EBIT, % | 35.9 | 40.97 | 37.15 | 38.23 | 40.4 | 38.53 | 38.53 | 38.53 | 38.53 | 38.53 |
| Total Cash | 3,083.2 | 3,790.5 | 4,810.1 | 6,162.6 | 6,807.3 | 8,053.6 | 9,621.6 | 11,495.0 | 13,733.1 | 16,407.0 |
| Total Cash, percent | .0 | .0 | .0 | .0 | .0 | .0 | .0 | .0 | .0 | .0 |
| Account Receivables | 928.6 | 1,011.4 | 1,278.6 | 1,872.6 | 1,102.7 | 2,095.9 | 2,504.0 | 2,991.6 | 3,574.0 | 4,269.9 |
| Account Receivables, % | 13.16 | 11.12 | 13.16 | 16.48 | 7.75 | 12.33 | 12.33 | 12.33 | 12.33 | 12.33 |
| Inventories | .0 | 750.1 | -3,298.3 | .0 | .0 | -873.3 | -1,043.3 | -1,246.5 | -1,489.2 | -1,779.1 |
| Inventories, % | 0 | 8.25 | -33.94 | 0 | 0 | -5.14 | -5.14 | -5.14 | -5.14 | -5.14 |
| Accounts Payable | 529.1 | 489.5 | 114.6 | 646.0 | 798.5 | 861.8 | 1,029.6 | 1,230.1 | 1,469.6 | 1,755.8 |
| Accounts Payable, % | 7.5 | 5.38 | 1.18 | 5.68 | 5.61 | 5.07 | 5.07 | 5.07 | 5.07 | 5.07 |
| Capital Expenditure | -242.5 | -622.5 | -445.1 | -383.7 | -1,183.8 | -902.7 | -1,078.4 | -1,288.4 | -1,539.3 | -1,839.0 |
| Capital Expenditure, % | -3.44 | -6.84 | -4.58 | -3.38 | -8.32 | -5.31 | -5.31 | -5.31 | -5.31 | -5.31 |
| Tax Rate, % | 24 | 24 | 24 | 24 | 24 | 24 | 24 | 24 | 24 | 24 |
| EBITAT | 1,894.2 | 2,794.5 | 2,708.8 | 3,291.7 | 4,368.0 | 4,931.5 | 5,891.7 | 7,038.8 | 8,409.3 | 10,046.6 |
| Depreciation | ||||||||||
| Changes in Account Receivables | ||||||||||
| Changes in Inventories | ||||||||||
| Changes in Accounts Payable | ||||||||||
| Capital Expenditure | ||||||||||
| UFCF | 1,403.6 | 1,517.4 | 5,922.3 | -16.9 | 4,590.4 | 4,460.7 | 5,326.6 | 6,363.7 | 7,602.8 | 9,083.1 |
| WACC, % | 4.55 | 4.55 | 4.55 | 4.55 | 4.55 | 4.55 | 4.55 | 4.55 | 4.55 | 4.55 |
| PV UFCF | ||||||||||
| SUM PV UFCF | 28,345.7 | |||||||||
| Long Term Growth Rate, % | 4.00 | |||||||||
| Free cash flow (T + 1) | 9,446 | |||||||||
| Terminal Value | 1,728,370 | |||||||||
| Present Terminal Value | 1,383,848 | |||||||||
| Enterprise Value | 1,412,193 | |||||||||
| Net Debt | -1,676 | |||||||||
| Equity Value | 1,413,870 | |||||||||
| Diluted Shares Outstanding, MM | 49 | |||||||||
| Equity Value Per Share | 28,574.03 |
What You Will Receive
- Genuine CAMSNS Data: Preloaded financial details – from revenue to EBIT – derived from actual and projected figures.
- Complete Customization: Modify all essential parameters (yellow cells) such as WACC, growth %, and tax rates.
- Instant Valuation Updates: Automatic recalculations to assess the effects of changes on CAMSNS’s fair value.
- Dynamic Excel Template: Designed for quick modifications, scenario analysis, and comprehensive projections.
- Efficient and Precise: Avoid starting from scratch with your models while ensuring accuracy and flexibility.
Key Features
- Comprehensive DCF Calculator: Offers in-depth unlevered and levered DCF valuation models tailored for Computer Age Management Services Limited (CAMSNS).
- WACC Calculator: Features a pre-designed Weighted Average Cost of Capital sheet with adjustable inputs for precise calculations.
- Customizable Forecast Assumptions: Easily alter growth rates, capital expenditures, and discount rates to suit your analysis.
- Integrated Financial Ratios: Evaluate profitability, leverage, and efficiency ratios specific to Computer Age Management Services Limited (CAMSNS).
- Dashboard and Charts: Visual representations provide a clear overview of essential valuation metrics for streamlined analysis.
How It Works
- Step 1: Download the Excel file for Computer Age Management Services Limited (CAMSNS).
- Step 2: Examine the pre-filled financial data and forecasts for CAMSNS.
- Step 3: Adjust key inputs such as revenue growth, WACC, and tax rates (highlighted cells).
- Step 4: Observe the DCF model update in real-time as you modify your assumptions.
- Step 5: Evaluate the outputs and leverage the results for your investment strategies.
Why Opt for CAMSNS Calculator?
- Precision: Accurate financial data derived from CAMSNS's trusted sources.
- Versatility: Allows users to easily test and adjust inputs according to their needs.
- Efficiency: Bypass the complexities of creating a DCF model from the ground up.
- Enterprise-Level: Crafted with the meticulousness and functionality expected by CFOs.
- Intuitive: Simple to navigate, even for individuals lacking advanced financial modeling skills.
Who Can Benefit from This Product?
- Individual Investors: Make knowledgeable decisions regarding the purchase or sale of CAMSNS stock.
- Financial Analysts: Enhance valuation processes with readily available financial models tailored for CAMSNS.
- Consultants: Provide clients with swift and precise valuation insights related to CAMSNS.
- Business Owners: Gain insights into the valuation of companies like CAMSNS to influence your own business strategy.
- Finance Students: Acquire valuation skills through the exploration of real-world data and case studies involving CAMSNS.
Contents of the CAMSNS Template
- Preloaded CAMSNS Data: Historical and projected financial metrics, including revenue, EBIT, and capital expenditures.
- DCF and WACC Models: Advanced spreadsheets for calculating intrinsic value and Weighted Average Cost of Capital.
- Editable Inputs: Cells highlighted in yellow for modifying revenue growth, tax rates, and discount rates.
- Financial Statements: Detailed annual and quarterly financial reports for comprehensive analysis.
- Key Ratios: Ratios for profitability, leverage, and efficiency to assess financial performance.
- Dashboard and Charts: Visual representations of valuation results and underlying assumptions.
Disclaimer
All information, articles, and product details provided on this website are for general informational and educational purposes only. We do not claim any ownership over, nor do we intend to infringe upon, any trademarks, copyrights, logos, brand names, or other intellectual property mentioned or depicted on this site. Such intellectual property remains the property of its respective owners, and any references here are made solely for identification or informational purposes, without implying any affiliation, endorsement, or partnership.
We make no representations or warranties, express or implied, regarding the accuracy, completeness, or suitability of any content or products presented. Nothing on this website should be construed as legal, tax, investment, financial, medical, or other professional advice. In addition, no part of this site—including articles or product references—constitutes a solicitation, recommendation, endorsement, advertisement, or offer to buy or sell any securities, franchises, or other financial instruments, particularly in jurisdictions where such activity would be unlawful.
All content is of a general nature and may not address the specific circumstances of any individual or entity. It is not a substitute for professional advice or services. Any actions you take based on the information provided here are strictly at your own risk. You accept full responsibility for any decisions or outcomes arising from your use of this website and agree to release us from any liability in connection with your use of, or reliance upon, the content or products found herein.