
|
Carmila S.A. (CARM.PA) DCF Valuation |
Fully Editable: Tailor To Your Needs In Excel Or Sheets
Professional Design: Trusted, Industry-Standard Templates
Investor-Approved Valuation Models
MAC/PC Compatible, Fully Unlocked
No Expertise Is Needed; Easy To Follow
Carmila S.A. (CARM.PA) Bundle
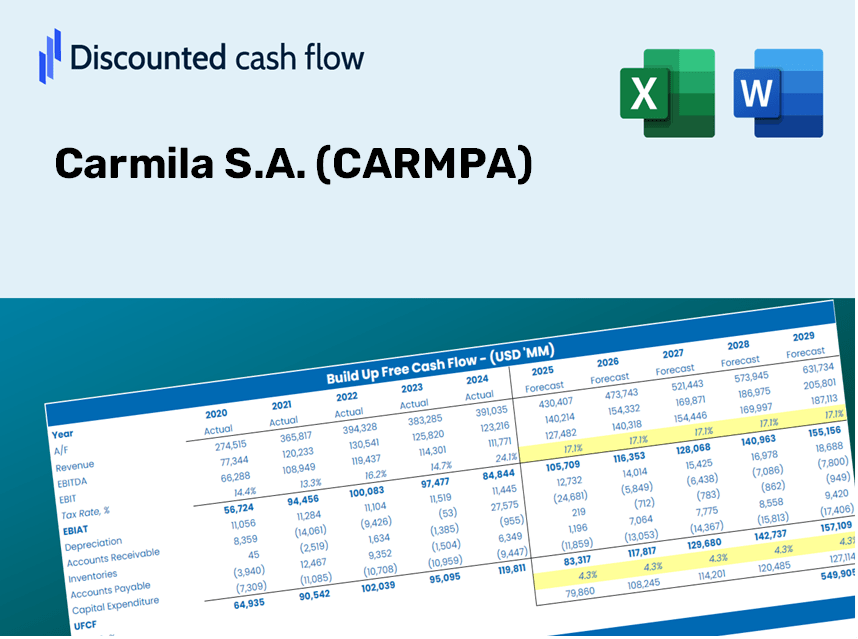
Designed for accuracy, our (CARMPA) DCF Calculator empowers you to assess Carmila S.A. valuation using real-world financial data, offering complete flexibility to modify all essential parameters for enhanced projections.
Discounted Cash Flow (DCF) - (USD MM)
| Year | AY1 2020 |
AY2 2021 |
AY3 2022 |
AY4 2023 |
AY5 2024 |
FY1 2025 |
FY2 2026 |
FY3 2027 |
FY4 2028 |
FY5 2029 |
|---|---|---|---|---|---|---|---|---|---|---|
| Revenue | 439.9 | 444.3 | 472.7 | 486.1 | 506.9 | 525.3 | 544.4 | 564.1 | 584.6 | 605.7 |
| Revenue Growth, % | 0 | 0.99921 | 6.38 | 2.84 | 4.28 | 3.63 | 3.63 | 3.63 | 3.63 | 3.63 |
| EBITDA | 216.6 | 237.3 | 289.7 | 298.0 | 431.2 | 326.0 | 337.8 | 350.1 | 362.8 | 375.9 |
| EBITDA, % | 49.23 | 53.4 | 61.29 | 61.3 | 85.06 | 62.06 | 62.06 | 62.06 | 62.06 | 62.06 |
| Depreciation | 2.9 | .5 | 1.0 | 5.9 | 3.9 | 3.1 | 3.2 | 3.4 | 3.5 | 3.6 |
| Depreciation, % | 0.66962 | 0.11095 | 0.20965 | 1.21 | 0.77366 | 0.59432 | 0.59432 | 0.59432 | 0.59432 | 0.59432 |
| EBIT | 213.7 | 236.8 | 288.7 | 292.1 | 427.3 | 322.9 | 334.6 | 346.7 | 359.3 | 372.3 |
| EBIT, % | 48.56 | 53.29 | 61.08 | 60.1 | 84.29 | 61.46 | 61.46 | 61.46 | 61.46 | 61.46 |
| Total Cash | 320.3 | 238.3 | 356.7 | 860.2 | 154.4 | 349.2 | 361.8 | 375.0 | 388.5 | 402.6 |
| Total Cash, percent | .0 | .0 | .0 | .0 | .0 | .0 | .0 | .0 | .0 | .0 |
| Account Receivables | 197.0 | 75.5 | 101.7 | 158.9 | 156.3 | 154.2 | 159.8 | 165.6 | 171.6 | 177.8 |
| Account Receivables, % | 44.77 | 16.99 | 21.51 | 32.68 | 30.82 | 29.36 | 29.36 | 29.36 | 29.36 | 29.36 |
| Inventories | .0 | .0 | .0 | .0 | .0 | .0 | .0 | .0 | .0 | .0 |
| Inventories, % | 0 | 0 | 0 | 0 | 0 | 0 | 0 | 0 | 0 | 0 |
| Accounts Payable | 27.8 | 21.0 | 19.7 | 19.4 | 38.6 | 28.2 | 29.2 | 30.2 | 31.3 | 32.5 |
| Accounts Payable, % | 6.31 | 4.72 | 4.17 | 3.99 | 7.61 | 5.36 | 5.36 | 5.36 | 5.36 | 5.36 |
| Capital Expenditure | -1.0 | -85.8 | -25.0 | -14.5 | -3.1 | -29.8 | -30.9 | -32.0 | -33.2 | -34.4 |
| Capital Expenditure, % | -0.21593 | -19.3 | -5.3 | -2.98 | -0.60204 | -5.68 | -5.68 | -5.68 | -5.68 | -5.68 |
| Tax Rate, % | 0.60711 | 0.60711 | 0.60711 | 0.60711 | 0.60711 | 0.60711 | 0.60711 | 0.60711 | 0.60711 | 0.60711 |
| EBITAT | 213.9 | 283.4 | 285.1 | 85.8 | 424.7 | 276.1 | 286.1 | 296.4 | 307.2 | 318.3 |
| Depreciation | ||||||||||
| Changes in Account Receivables | ||||||||||
| Changes in Inventories | ||||||||||
| Changes in Accounts Payable | ||||||||||
| Capital Expenditure | ||||||||||
| UFCF | 46.7 | 312.8 | 233.6 | 19.7 | 447.4 | 241.0 | 253.8 | 263.0 | 272.6 | 282.4 |
| WACC, % | 7.26 | 7.26 | 7.23 | 5.73 | 7.25 | 6.95 | 6.95 | 6.95 | 6.95 | 6.95 |
| PV UFCF | ||||||||||
| SUM PV UFCF | 1,072.4 | |||||||||
| Long Term Growth Rate, % | 2.00 | |||||||||
| Free cash flow (T + 1) | 288 | |||||||||
| Terminal Value | 5,822 | |||||||||
| Present Terminal Value | 4,161 | |||||||||
| Enterprise Value | 5,233 | |||||||||
| Net Debt | 2,598 | |||||||||
| Equity Value | 2,635 | |||||||||
| Diluted Shares Outstanding, MM | 142 | |||||||||
| Equity Value Per Share | 18.56 |
Benefits of Choosing Carmila S.A. (CARMPA)
- Comprehensive Financial Model: Leverage Carmila's actual performance data for accurate DCF valuation.
- Complete Forecast Management: Fine-tune revenue growth rates, profit margins, WACC, and other essential parameters.
- Real-Time Calculations: Instantaneous updates provide immediate feedback as you modify inputs.
- Professional-Grade Template: A polished Excel document crafted for robust valuation needs.
- Flexible and Repeatable: Designed for adaptability, suitable for ongoing detailed forecasting.
Key Features
- Pre-Loaded Data: Carmila S.A.’s historical financial records and pre-filled projections.
- Fully Customizable Inputs: Modify WACC, tax rates, revenue growth, and EBITDA margins as needed.
- Real-Time Calculations: Observe the intrinsic value of Carmila S.A. (CARMPA) update instantly.
- Intuitive Visual Outputs: Dashboard charts present valuation findings and essential metrics clearly.
- Designed for Precision: A reliable tool tailored for analysts, investors, and finance professionals.
How It Functions
- Step 1: Download the Excel file.
- Step 2: Examine Carmila S.A.'s pre-filled financial data and projections.
- Step 3: Adjust key inputs such as revenue growth, WACC, and tax rates (highlighted cells).
- Step 4: Observe the DCF model update in real-time as you modify your assumptions.
- Step 5: Evaluate the outputs and leverage the results for your investment strategies.
Why Opt for the Carmila S.A. Calculator?
- All-in-One Solution: Features DCF, WACC, and an array of financial ratio analyses bundled together.
- Flexible Inputs: Modify the yellow-highlighted cells to explore different scenarios.
- In-Depth Analysis: Instantly calculates Carmila’s intrinsic value and Net Present Value.
- Preloaded Information: Historical and projected data provide reliable starting points.
- Expert-Level Quality: Perfect for financial analysts, investors, and business consultants.
Who Should Use This Product?
- Investors: Accurately assess Carmila S.A.'s (CARMPA) fair value before making investment choices.
- CFOs: Utilize a high-quality DCF model for financial reporting and analysis related to Carmila S.A. (CARMPA).
- Consultants: Efficiently customize the template for valuation reports tailored to Carmila S.A. (CARMPA) clients.
- Entrepreneurs: Discover insights into financial modeling practices used by Fortune 500 companies in relation to Carmila S.A. (CARMPA).
- Educators: Employ it as a teaching tool to illustrate valuation methodologies relevant to Carmila S.A. (CARMPA).
Contents of the Template
- Historical Data: Incorporates Carmila S.A.'s (CARMPA) previous financial performance and foundational forecasts.
- DCF and Levered DCF Models: Comprehensive templates designed to assess Carmila S.A.'s (CARMPA) intrinsic value.
- WACC Sheet: Ready-made calculations for the Weighted Average Cost of Capital.
- Editable Inputs: Customize essential variables such as growth rates, EBITDA percentages, and CAPEX assumptions.
- Quarterly and Annual Statements: An exhaustive overview of Carmila S.A.'s (CARMPA) financials.
- Interactive Dashboard: Dynamically visualize valuation outcomes and future projections.
Disclaimer
All information, articles, and product details provided on this website are for general informational and educational purposes only. We do not claim any ownership over, nor do we intend to infringe upon, any trademarks, copyrights, logos, brand names, or other intellectual property mentioned or depicted on this site. Such intellectual property remains the property of its respective owners, and any references here are made solely for identification or informational purposes, without implying any affiliation, endorsement, or partnership.
We make no representations or warranties, express or implied, regarding the accuracy, completeness, or suitability of any content or products presented. Nothing on this website should be construed as legal, tax, investment, financial, medical, or other professional advice. In addition, no part of this site—including articles or product references—constitutes a solicitation, recommendation, endorsement, advertisement, or offer to buy or sell any securities, franchises, or other financial instruments, particularly in jurisdictions where such activity would be unlawful.
All content is of a general nature and may not address the specific circumstances of any individual or entity. It is not a substitute for professional advice or services. Any actions you take based on the information provided here are strictly at your own risk. You accept full responsibility for any decisions or outcomes arising from your use of this website and agree to release us from any liability in connection with your use of, or reliance upon, the content or products found herein.