
|
Castrol India Limited (CASTROLIND.NS) DCF Valuation |
Fully Editable: Tailor To Your Needs In Excel Or Sheets
Professional Design: Trusted, Industry-Standard Templates
Investor-Approved Valuation Models
MAC/PC Compatible, Fully Unlocked
No Expertise Is Needed; Easy To Follow
Castrol India Limited (CASTROLIND.NS) Bundle
Explore the financial future of Castrol India Limited with our user-friendly DCF Calculator! Enter your assumptions regarding growth, margins, and costs to calculate the intrinsic value of Castrol India Limited (CASTROLINDNS) and refine your investment strategy.
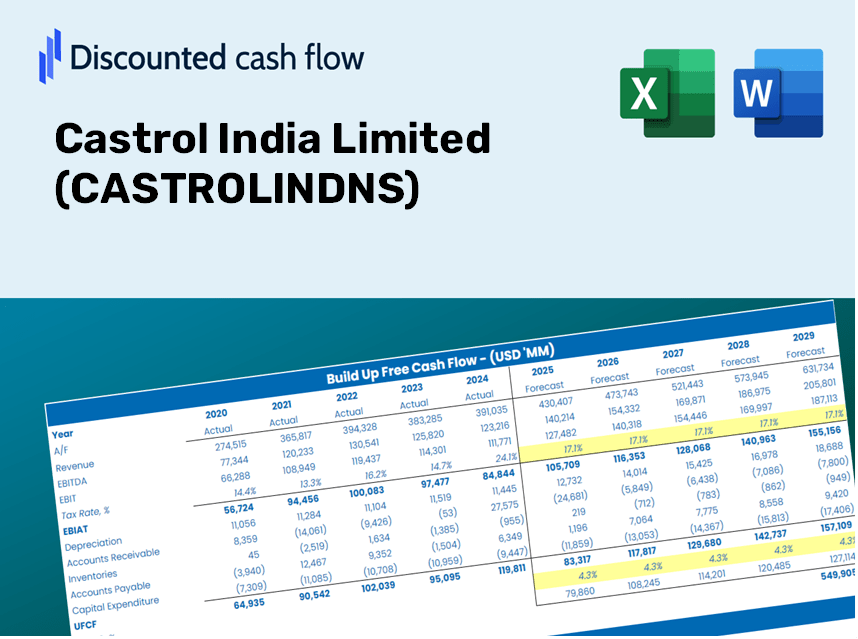
Discounted Cash Flow (DCF) - (USD MM)
| Year | AY1 2020 |
AY2 2021 |
AY3 2022 |
AY4 2023 |
AY5 2024 |
FY1 2025 |
FY2 2026 |
FY3 2027 |
FY4 2028 |
FY5 2029 |
|---|---|---|---|---|---|---|---|---|---|---|
| Revenue | 30,036.5 | 41,920.6 | 47,744.9 | 50,746.1 | 53,648.5 | 62,428.7 | 72,645.8 | 84,535.2 | 98,370.3 | 114,469.7 |
| Revenue Growth, % | 0 | 39.57 | 13.89 | 6.29 | 5.72 | 16.37 | 16.37 | 16.37 | 16.37 | 16.37 |
| EBITDA | 8,251.1 | 10,694.3 | 11,252.3 | 12,068.6 | 12,758.5 | 15,496.4 | 18,032.5 | 20,983.8 | 24,418.0 | 28,414.3 |
| EBITDA, % | 27.47 | 25.51 | 23.57 | 23.78 | 23.78 | 24.82 | 24.82 | 24.82 | 24.82 | 24.82 |
| Depreciation | 675.6 | 684.0 | 679.0 | 735.7 | 765.6 | 1,021.3 | 1,188.5 | 1,383.0 | 1,609.3 | 1,872.7 |
| Depreciation, % | 2.25 | 1.63 | 1.42 | 1.45 | 1.43 | 1.64 | 1.64 | 1.64 | 1.64 | 1.64 |
| EBIT | 7,575.5 | 10,010.3 | 10,573.3 | 11,332.9 | 11,992.9 | 14,475.1 | 16,844.1 | 19,600.8 | 22,808.7 | 26,541.6 |
| EBIT, % | 25.22 | 23.88 | 22.15 | 22.33 | 22.35 | 23.19 | 23.19 | 23.19 | 23.19 | 23.19 |
| Total Cash | 12,536.5 | 12,812.2 | 11,995.0 | 11,832.1 | 13,828.7 | 18,293.7 | 21,287.6 | 24,771.6 | 28,825.7 | 33,543.4 |
| Total Cash, percent | .0 | .0 | .0 | .0 | .0 | .0 | .0 | .0 | .0 | .0 |
| Account Receivables | 2,160.6 | 3,485.3 | 3,761.9 | 4,779.4 | 4,993.6 | 5,258.1 | 6,118.6 | 7,120.0 | 8,285.3 | 9,641.3 |
| Account Receivables, % | 7.19 | 8.31 | 7.88 | 9.42 | 9.31 | 8.42 | 8.42 | 8.42 | 8.42 | 8.42 |
| Inventories | 3,668.7 | 4,916.5 | 5,344.4 | 5,329.2 | 5,242.1 | 6,918.2 | 8,050.4 | 9,368.0 | 10,901.2 | 12,685.3 |
| Inventories, % | 12.21 | 11.73 | 11.19 | 10.5 | 9.77 | 11.08 | 11.08 | 11.08 | 11.08 | 11.08 |
| Accounts Payable | 5,455.3 | 6,206.5 | 6,788.6 | 7,064.3 | 7,036.5 | 9,267.3 | 10,784.0 | 12,548.9 | 14,602.7 | 16,992.5 |
| Accounts Payable, % | 18.16 | 14.81 | 14.22 | 13.92 | 13.12 | 14.84 | 14.84 | 14.84 | 14.84 | 14.84 |
| Capital Expenditure | -416.7 | -832.1 | -1,097.1 | -955.4 | -927.0 | -1,158.8 | -1,348.4 | -1,569.1 | -1,825.9 | -2,124.7 |
| Capital Expenditure, % | -1.39 | -1.98 | -2.3 | -1.88 | -1.73 | -1.86 | -1.86 | -1.86 | -1.86 | -1.86 |
| Tax Rate, % | 26.27 | 26.27 | 26.27 | 26.27 | 26.27 | 26.27 | 26.27 | 26.27 | 26.27 | 26.27 |
| EBITAT | 5,623.0 | 7,372.8 | 7,887.3 | 8,291.5 | 8,842.3 | 10,693.2 | 12,443.3 | 14,479.8 | 16,849.5 | 19,607.2 |
| Depreciation | ||||||||||
| Changes in Account Receivables | ||||||||||
| Changes in Inventories | ||||||||||
| Changes in Accounts Payable | ||||||||||
| Capital Expenditure | ||||||||||
| UFCF | 5,507.9 | 5,403.4 | 7,346.8 | 7,345.2 | 8,526.0 | 10,846.0 | 11,807.3 | 13,739.6 | 15,988.3 | 18,605.0 |
| WACC, % | 5.5 | 5.5 | 5.5 | 5.5 | 5.5 | 5.5 | 5.5 | 5.5 | 5.5 | 5.5 |
| PV UFCF | ||||||||||
| SUM PV UFCF | 59,731.5 | |||||||||
| Long Term Growth Rate, % | 3.00 | |||||||||
| Free cash flow (T + 1) | 19,163 | |||||||||
| Terminal Value | 766,607 | |||||||||
| Present Terminal Value | 586,565 | |||||||||
| Enterprise Value | 646,297 | |||||||||
| Net Debt | -3,709 | |||||||||
| Equity Value | 650,005 | |||||||||
| Diluted Shares Outstanding, MM | 989 | |||||||||
| Equity Value Per Share | 657.15 |
What You Will Receive
- Authentic CASTROLINDNS Financial Data: Pre-loaded with Castrol India Limited’s historical and forecasted data for accurate analysis.
- Completely Customizable Template: Easily adjust key parameters such as revenue growth, WACC, and EBITDA percentage.
- Instant Calculations: Observe real-time updates to Castrol India Limited's intrinsic value as you make adjustments.
- Professional Valuation Tool: Crafted for investors, analysts, and consultants who require precise DCF results.
- Intuitive Design: User-friendly format and straightforward instructions suitable for all skill levels.
Key Features
- Authentic Castrol Financial Data: Gain access to precise pre-loaded historical data and future forecasts.
- Adjustable Forecast Parameters: Modify yellow-highlighted cells such as WACC, growth rates, and profit margins.
- Automated Calculations: Instant updates to DCF, Net Present Value (NPV), and cash flow assessments.
- Interactive Dashboard: User-friendly charts and summaries to clearly present your valuation outcomes.
- Suitable for All Skill Levels: A straightforward, intuitive design tailored for investors, CFOs, and consultants alike.
How It Works
- 1. Open the Template: Download and access the Excel file featuring Castrol India Limited’s preloaded data.
- 2. Edit Assumptions: Modify essential inputs such as growth rates, WACC, and capital expenditures to fit your analysis.
- 3. View Results Instantly: The DCF model automatically computes intrinsic value and NPV in real-time.
- 4. Test Scenarios: Evaluate various forecasts to explore different valuation scenarios for Castrol India Limited (CASTROLINDNS).
- 5. Use with Confidence: Present detailed valuation analyses to bolster your decision-making process.
Why Choose This Calculator for Castrol India Limited (CASTROLINDNS)?
- User-Friendly Interface: Tailored for both novices and seasoned users.
- Customizable Inputs: Adjust parameters easily to align with your analysis.
- Real-Time Updates: Witness immediate changes to Castrol’s valuation as you alter inputs.
- Preloaded Data: Comes equipped with Castrol’s latest financial information for efficient analysis.
- Relied Upon by Experts: Favored by investors and analysts for making well-informed decisions.
Who Should Use This Product?
- Investors: Accurately assess the fair value of Castrol India Limited (CASTROLINDNS) for informed investment decisions.
- CFOs: Utilize a high-quality DCF model for comprehensive financial reporting and analysis.
- Consultants: Easily modify the template for client valuation reports featuring Castrol India Limited (CASTROLINDNS).
- Entrepreneurs: Discover financial modeling insights as practiced by leading companies like Castrol India Limited (CASTROLINDNS).
- Educators: Employ it as a resource to illustrate various valuation methodologies in the classroom.
Contents of the Template
- Pre-Filled Data: Contains Castrol India Limited's historical financials and projections.
- Discounted Cash Flow Model: An editable DCF valuation model featuring automatic calculations.
- Weighted Average Cost of Capital (WACC): A dedicated worksheet for determining WACC based on tailored inputs.
- Key Financial Ratios: Evaluate Castrol India Limited's profitability, efficiency, and leverage metrics.
- Customizable Inputs: Easily modify revenue growth, profit margins, and tax rates.
- User-Friendly Dashboard: Visuals and tables that highlight essential valuation outcomes.
Disclaimer
All information, articles, and product details provided on this website are for general informational and educational purposes only. We do not claim any ownership over, nor do we intend to infringe upon, any trademarks, copyrights, logos, brand names, or other intellectual property mentioned or depicted on this site. Such intellectual property remains the property of its respective owners, and any references here are made solely for identification or informational purposes, without implying any affiliation, endorsement, or partnership.
We make no representations or warranties, express or implied, regarding the accuracy, completeness, or suitability of any content or products presented. Nothing on this website should be construed as legal, tax, investment, financial, medical, or other professional advice. In addition, no part of this site—including articles or product references—constitutes a solicitation, recommendation, endorsement, advertisement, or offer to buy or sell any securities, franchises, or other financial instruments, particularly in jurisdictions where such activity would be unlawful.
All content is of a general nature and may not address the specific circumstances of any individual or entity. It is not a substitute for professional advice or services. Any actions you take based on the information provided here are strictly at your own risk. You accept full responsibility for any decisions or outcomes arising from your use of this website and agree to release us from any liability in connection with your use of, or reliance upon, the content or products found herein.