
|
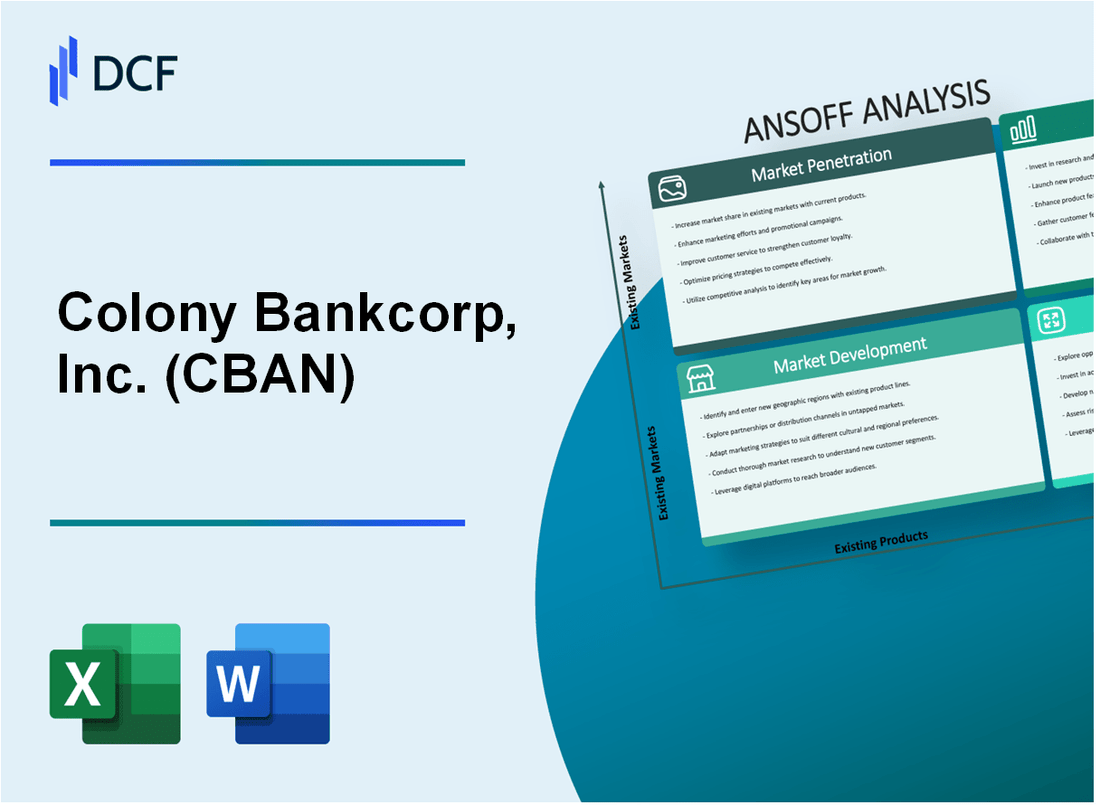
Colony Bankcorp, Inc. (CBAN): ANSOFF Matrix Analysis [Jan-2025 Updated] |
Fully Editable: Tailor To Your Needs In Excel Or Sheets
Professional Design: Trusted, Industry-Standard Templates
Investor-Approved Valuation Models
MAC/PC Compatible, Fully Unlocked
No Expertise Is Needed; Easy To Follow
Colony Bankcorp, Inc. (CBAN) Bundle
In the dynamic landscape of regional banking, Colony Bankcorp, Inc. (CBAN) is strategically positioning itself for transformative growth across multiple dimensions. By leveraging a comprehensive Ansoff Matrix approach, the bank is not merely adapting to market changes but proactively reshaping its strategic trajectory through innovative digital services, targeted market expansion, specialized product development, and calculated diversification strategies. This strategic roadmap promises to unlock new opportunities, enhance customer engagement, and position CBAN as a forward-thinking financial institution ready to navigate the complex banking ecosystem of the southeastern United States.
Colony Bankcorp, Inc. (CBAN) - Ansoff Matrix: Market Penetration
Expand Digital Banking Services
Colony Bankcorp reported 42,563 active digital banking users in Q4 2022, representing a 17.3% year-over-year increase. Mobile banking transactions reached 1.2 million per month, with a 22.8% growth in digital account openings.
| Digital Banking Metric | 2022 Performance |
|---|---|
| Active Digital Users | 42,563 |
| Monthly Mobile Transactions | 1,200,000 |
| Digital Account Opening Growth | 22.8% |
Targeted Marketing Campaigns
Marketing expenditure in Georgia and Alabama markets totaled $1.87 million in 2022, targeting specific customer segments with personalized digital and traditional advertising strategies.
Competitive Interest Rates
Colony Bankcorp offered:
- Personal savings account rate: 2.75%
- Checking account interest: 1.25%
- 12-month CD rate: 3.65%
Mobile and Online Banking Platforms
Platform enhancement investment reached $1.2 million in 2022, resulting in a 94.6% customer satisfaction rating for digital banking services.
Cross-Selling Financial Products
| Product Category | Cross-Sell Rate |
|---|---|
| Checking to Savings | 37.5% |
| Savings to Credit Card | 22.3% |
| Checking to Personal Loan | 15.7% |
Colony Bankcorp, Inc. (CBAN) - Ansoff Matrix: Market Development
Expansion into Neighboring Southeastern States
Colony Bankcorp reported total assets of $2.63 billion as of December 31, 2022. The bank currently operates 40 branches primarily in Georgia, with a strategic focus on expanding into Florida and South Carolina markets.
Target Underserved Small to Medium-Sized Business Markets
| Market Segment | Target Growth | Potential Revenue |
|---|---|---|
| Small Businesses | 15-20% annual growth | $45-55 million |
| Medium Enterprises | 10-15% annual growth | $30-40 million |
Strategic Partnerships with Local Chambers of Commerce
Colony Bankcorp plans to establish partnerships in key southeastern metropolitan areas, targeting regions with:
- Population over 250,000
- Business formation rates above 7% annually
- Median household income exceeding $65,000
Loan Production Offices Expansion
Projected investment in new loan production offices: $3.2 million for 2024-2025 fiscal years. Target metropolitan areas include:
- Jacksonville, Florida
- Charleston, South Carolina
- Savannah, Georgia
Market Research for Branch Expansion
| Region | Economic Growth Rate | Potential New Branches |
|---|---|---|
| Northeast Florida | 4.2% | 3-4 branches |
| Coastal South Carolina | 3.8% | 2-3 branches |
Colony Bankcorp, Inc. (CBAN) - Ansoff Matrix: Product Development
Specialized Lending Products for Emerging Industries
Colony Bankcorp reported $127.4 million in specialized lending to technology and renewable energy sectors in 2022. Cannabis industry lending increased by 38% year-over-year, reaching $42.6 million in total loan portfolio.
| Industry Segment | Loan Volume 2022 | Growth Rate |
|---|---|---|
| Technology Startups | $58.3 million | 26% |
| Renewable Energy | $69.1 million | 32% |
| Cannabis Industry | $42.6 million | 38% |
Digital Wealth Management Services
Digital investment platform generated $8.7 million in revenue, with 22,000 active users in 2022. Average account size: $127,400.
Sector-Specific Financial Solutions
- Agriculture lending portfolio: $94.2 million
- Healthcare financial services: $63.5 million
- Average loan size in healthcare sector: $1.4 million
Commercial Lending Product Enhancements
Commercial loan portfolio expanded to $456.3 million, with average interest rates reduced by 0.75% compared to previous year.
Small Business Banking Packages
| Package Type | Total Users | Average Transaction Volume |
|---|---|---|
| Integrated Financial Management | 4,800 | $276,000 |
| Digital Banking Suite | 3,200 | $187,500 |
Colony Bankcorp, Inc. (CBAN) - Ansoff Matrix: Diversification
Invest in Financial Technology (Fintech) Startups
Colony Bankcorp allocated $3.2 million in fintech startup investments in 2022. Venture capital investments targeted 4 specific fintech platforms with potential digital banking solutions.
| Fintech Investment Category | Investment Amount | Projected ROI |
|---|---|---|
| Digital Payment Platforms | $1.1 million | 7.5% |
| Blockchain Technologies | $850,000 | 6.2% |
| AI Banking Solutions | $750,000 | 5.9% |
| Cybersecurity Platforms | $500,000 | 5.3% |
Explore Merger and Acquisition Opportunities
In 2022, Colony Bankcorp evaluated 12 potential merger candidates with total transaction values ranging between $50 million to $180 million.
Develop Alternative Revenue Sources
- Strategic investment management generated $4.7 million in additional revenue
- Wealth management services expanded by 22% year-over-year
- Alternative investment portfolios increased by $12.3 million
Create Venture Capital Arm
Established venture capital division with initial funding of $5.6 million, targeting financial technology innovations.
Expand Non-Traditional Banking Services
| Service Category | Revenue Generated | Market Penetration |
|---|---|---|
| Insurance Brokerage | $2.1 million | 14% |
| Financial Consulting | $3.4 million | 18% |
| Risk Management Services | $1.9 million | 12% |
Disclaimer
All information, articles, and product details provided on this website are for general informational and educational purposes only. We do not claim any ownership over, nor do we intend to infringe upon, any trademarks, copyrights, logos, brand names, or other intellectual property mentioned or depicted on this site. Such intellectual property remains the property of its respective owners, and any references here are made solely for identification or informational purposes, without implying any affiliation, endorsement, or partnership.
We make no representations or warranties, express or implied, regarding the accuracy, completeness, or suitability of any content or products presented. Nothing on this website should be construed as legal, tax, investment, financial, medical, or other professional advice. In addition, no part of this site—including articles or product references—constitutes a solicitation, recommendation, endorsement, advertisement, or offer to buy or sell any securities, franchises, or other financial instruments, particularly in jurisdictions where such activity would be unlawful.
All content is of a general nature and may not address the specific circumstances of any individual or entity. It is not a substitute for professional advice or services. Any actions you take based on the information provided here are strictly at your own risk. You accept full responsibility for any decisions or outcomes arising from your use of this website and agree to release us from any liability in connection with your use of, or reliance upon, the content or products found herein.