
|
Crescent Capital BDC, Inc. (CCAP) DCF Valuation |
Fully Editable: Tailor To Your Needs In Excel Or Sheets
Professional Design: Trusted, Industry-Standard Templates
Investor-Approved Valuation Models
MAC/PC Compatible, Fully Unlocked
No Expertise Is Needed; Easy To Follow
Crescent Capital BDC, Inc. (CCAP) Bundle
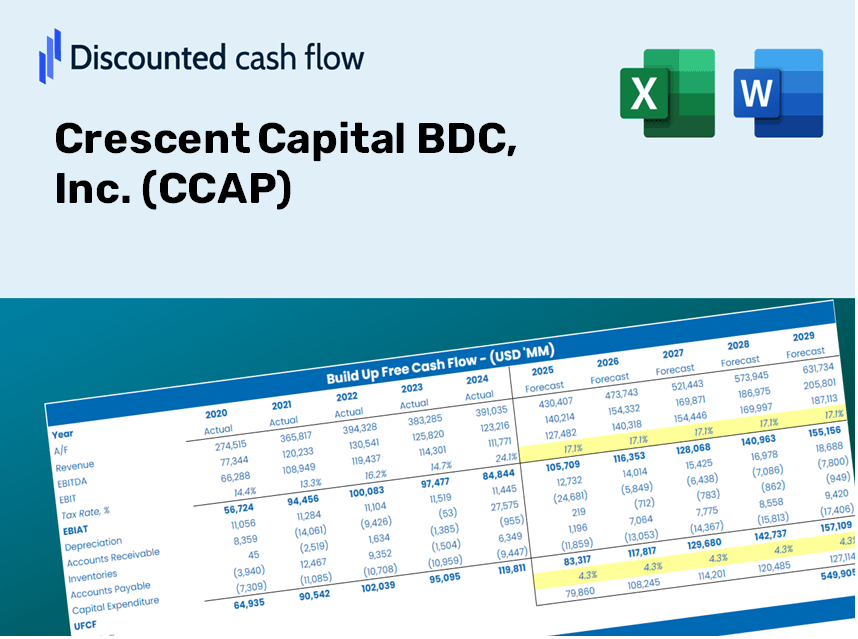
Evaluate Crescent Capital BDC, Inc.'s (CCAP) financial prospects like an expert! This (CCAP) DCF Calculator offers pre-filled financials along with the flexibility to modify revenue growth, WACC, margins, and other essential assumptions to align with your projections.
Discounted Cash Flow (DCF) - (USD MM)
| Year | AY1 2020 |
AY2 2021 |
AY3 2022 |
AY4 2023 |
AY5 2024 |
FY1 2025 |
FY2 2026 |
FY3 2027 |
FY4 2028 |
FY5 2029 |
|---|---|---|---|---|---|---|---|---|---|---|
| Revenue | 61.9 | 126.3 | 121.7 | 172.7 | 194.8 | 268.4 | 369.8 | 509.6 | 702.0 | 967.2 |
| Revenue Growth, % | 0 | 103.99 | -3.64 | 41.9 | 12.83 | 37.77 | 37.77 | 37.77 | 37.77 | 37.77 |
| EBITDA | 74.8 | 106.7 | 48.4 | 144.3 | 138.7 | 203.5 | 280.4 | 386.3 | 532.2 | 733.2 |
| EBITDA, % | 120.81 | 84.52 | 39.79 | 83.55 | 71.17 | 75.81 | 75.81 | 75.81 | 75.81 | 75.81 |
| Depreciation | .0 | .0 | .0 | .0 | .0 | .0 | .0 | .0 | .0 | .0 |
| Depreciation, % | 0 | 0 | 0 | 0 | 0 | 0 | 0 | 0 | 0 | 0 |
| EBIT | 74.8 | 106.7 | 48.4 | 144.3 | 138.7 | 203.5 | 280.4 | 386.3 | 532.2 | 733.2 |
| EBIT, % | 120.81 | 84.52 | 39.79 | 83.55 | 71.17 | 75.81 | 75.81 | 75.81 | 75.81 | 75.81 |
| Total Cash | 1.9 | 10.1 | 6.4 | 7.8 | 10.1 | 14.0 | 19.2 | 26.5 | 36.5 | 50.3 |
| Total Cash, percent | .0 | .0 | .0 | .0 | .0 | .0 | .0 | .0 | .0 | .0 |
| Account Receivables | 3.9 | 21.6 | 10.0 | 14.3 | 12.2 | 24.7 | 34.1 | 46.9 | 64.7 | 89.1 |
| Account Receivables, % | 6.24 | 17.13 | 8.18 | 8.25 | 6.25 | 9.21 | 9.21 | 9.21 | 9.21 | 9.21 |
| Inventories | .0 | .0 | .0 | .0 | .0 | .0 | .0 | .0 | .0 | .0 |
| Inventories, % | 0 | 0 | 0 | 0 | 0 | 0 | 0 | 0 | 0 | 0 |
| Accounts Payable | 15.5 | 18.2 | .5 | 26.1 | 26.0 | 36.6 | 50.5 | 69.6 | 95.8 | 132.0 |
| Accounts Payable, % | 24.99 | 14.39 | 0.42237 | 15.11 | 13.33 | 13.65 | 13.65 | 13.65 | 13.65 | 13.65 |
| Capital Expenditure | .0 | .0 | .0 | .0 | .0 | .0 | .0 | .0 | .0 | .0 |
| Capital Expenditure, % | 0 | 0 | 0 | 0 | 0 | 0 | 0 | 0 | 0 | 0 |
| Tax Rate, % | 1.46 | 1.46 | 1.46 | 1.46 | 1.46 | 1.46 | 1.46 | 1.46 | 1.46 | 1.46 |
| EBITAT | 73.8 | 102.3 | 45.6 | 143.8 | 136.6 | 198.2 | 273.0 | 376.1 | 518.2 | 714.0 |
| Depreciation | ||||||||||
| Changes in Account Receivables | ||||||||||
| Changes in Inventories | ||||||||||
| Changes in Accounts Payable | ||||||||||
| Capital Expenditure | ||||||||||
| UFCF | 85.4 | 87.2 | 39.6 | 165.1 | 138.6 | 196.3 | 277.5 | 382.3 | 526.8 | 725.8 |
| WACC, % | 6.56 | 6.43 | 6.36 | 6.6 | 6.55 | 6.5 | 6.5 | 6.5 | 6.5 | 6.5 |
| PV UFCF | ||||||||||
| SUM PV UFCF | 1,684.7 | |||||||||
| Long Term Growth Rate, % | 2.00 | |||||||||
| Free cash flow (T + 1) | 740 | |||||||||
| Terminal Value | 16,448 | |||||||||
| Present Terminal Value | 12,005 | |||||||||
| Enterprise Value | 13,689 | |||||||||
| Net Debt | 866 | |||||||||
| Equity Value | 12,824 | |||||||||
| Diluted Shares Outstanding, MM | 37 | |||||||||
| Equity Value Per Share | 346.01 |
What You Will Receive
- Authentic CCAP Financial Data: Comes pre-loaded with Crescent Capital BDC, Inc.'s historical and projected figures for accurate analysis.
- Completely Customizable Template: Easily adjust key inputs such as revenue growth, WACC, and EBITDA percentage.
- Instant Calculations: Watch as the intrinsic value of CCAP updates in real-time based on your modifications.
- Professional Valuation Tool: Tailored for investors, analysts, and consultants aiming for precise DCF outcomes.
- Intuitive Design: Featuring a straightforward layout and clear guidance suitable for all skill levels.
Key Features
- Authentic CCAP Financial Data: Gain access to precise pre-loaded historical data and insightful future projections.
- Customizable Forecast Parameters: Modify the yellow-highlighted cells including WACC, growth rates, and profit margins.
- Real-Time Calculations: Enjoy automatic updates to DCF, Net Present Value (NPV), and comprehensive cash flow analysis.
- Interactive Visual Dashboard: Utilize user-friendly charts and summaries to easily interpret your valuation results.
- Designed for All Users: A straightforward, intuitive framework tailored for investors, CFOs, and consultants alike.
How It Works
- Step 1: Download the prebuilt Excel template featuring data for Crescent Capital BDC, Inc. (CCAP).
- Step 2: Review the pre-filled sheets to familiarize yourself with the essential metrics.
- Step 3: Adjust forecasts and inputs in the editable yellow cells (WACC, growth, margins).
- Step 4: Instantly see the recalculated results, which include the intrinsic value of Crescent Capital BDC, Inc. (CCAP).
- Step 5: Use the outputs to make well-informed investment choices or generate comprehensive reports.
Why Opt for This Calculator?
- All-in-One Solution: Combines DCF, WACC, and financial ratio analyses tailored specifically for Crescent Capital BDC, Inc. (CCAP).
- Adjustable Parameters: Modify the yellow-highlighted fields to explore different scenarios.
- In-Depth Analysis: Automatically computes the intrinsic value and Net Present Value for Crescent Capital BDC, Inc. (CCAP).
- Pre-Loaded Information: Features historical and forecasted data for reliable baseline assessments.
- High-Quality Standards: Perfect for financial analysts, investors, and business consultants focused on Crescent Capital BDC, Inc. (CCAP).
Who Is This Product Ideal For?
- Finance Students: Master valuation techniques and apply them with live data using Crescent Capital BDC, Inc. (CCAP).
- Academics: Integrate professional models into your courses or research focused on Crescent Capital BDC, Inc. (CCAP).
- Investors: Validate your assumptions and evaluate valuation outcomes for Crescent Capital BDC, Inc. (CCAP) stock.
- Analysts: Enhance your efficiency with a pre-built, customizable DCF model tailored for Crescent Capital BDC, Inc. (CCAP).
- Small Business Owners: Understand the analysis techniques used for large public companies like Crescent Capital BDC, Inc. (CCAP).
Contents of the Template
- Operating and Balance Sheet Data: Pre-filled historical data and forecasts for Crescent Capital BDC, Inc. (CCAP), covering elements such as revenue, EBITDA, EBIT, and capital expenditures.
- WACC Calculation: A specific sheet dedicated to the Weighted Average Cost of Capital (WACC), with key parameters like Beta, risk-free rate, and share price included.
- DCF Valuation (Unlevered and Levered): Customizable Discounted Cash Flow models that illustrate intrinsic value through comprehensive calculations.
- Financial Statements: Pre-loaded annual and quarterly financial statements to aid in thorough analysis.
- Key Ratios: A collection of profitability, leverage, and efficiency ratios specifically for Crescent Capital BDC, Inc. (CCAP).
- Dashboard and Charts: A visual overview of valuation outputs and underlying assumptions to facilitate easy result analysis.
Disclaimer
All information, articles, and product details provided on this website are for general informational and educational purposes only. We do not claim any ownership over, nor do we intend to infringe upon, any trademarks, copyrights, logos, brand names, or other intellectual property mentioned or depicted on this site. Such intellectual property remains the property of its respective owners, and any references here are made solely for identification or informational purposes, without implying any affiliation, endorsement, or partnership.
We make no representations or warranties, express or implied, regarding the accuracy, completeness, or suitability of any content or products presented. Nothing on this website should be construed as legal, tax, investment, financial, medical, or other professional advice. In addition, no part of this site—including articles or product references—constitutes a solicitation, recommendation, endorsement, advertisement, or offer to buy or sell any securities, franchises, or other financial instruments, particularly in jurisdictions where such activity would be unlawful.
All content is of a general nature and may not address the specific circumstances of any individual or entity. It is not a substitute for professional advice or services. Any actions you take based on the information provided here are strictly at your own risk. You accept full responsibility for any decisions or outcomes arising from your use of this website and agree to release us from any liability in connection with your use of, or reliance upon, the content or products found herein.