
|
Cameco Corporation (CCJ) DCF Valuation |
Fully Editable: Tailor To Your Needs In Excel Or Sheets
Professional Design: Trusted, Industry-Standard Templates
Investor-Approved Valuation Models
MAC/PC Compatible, Fully Unlocked
No Expertise Is Needed; Easy To Follow
Cameco Corporation (CCJ) Bundle
Explore Cameco Corporation's (CCJ) financial outlook with our user-friendly DCF Calculator! Enter your projections for growth, margins, and expenses to determine Cameco Corporation's (CCJ) intrinsic value and enhance your investment approach.
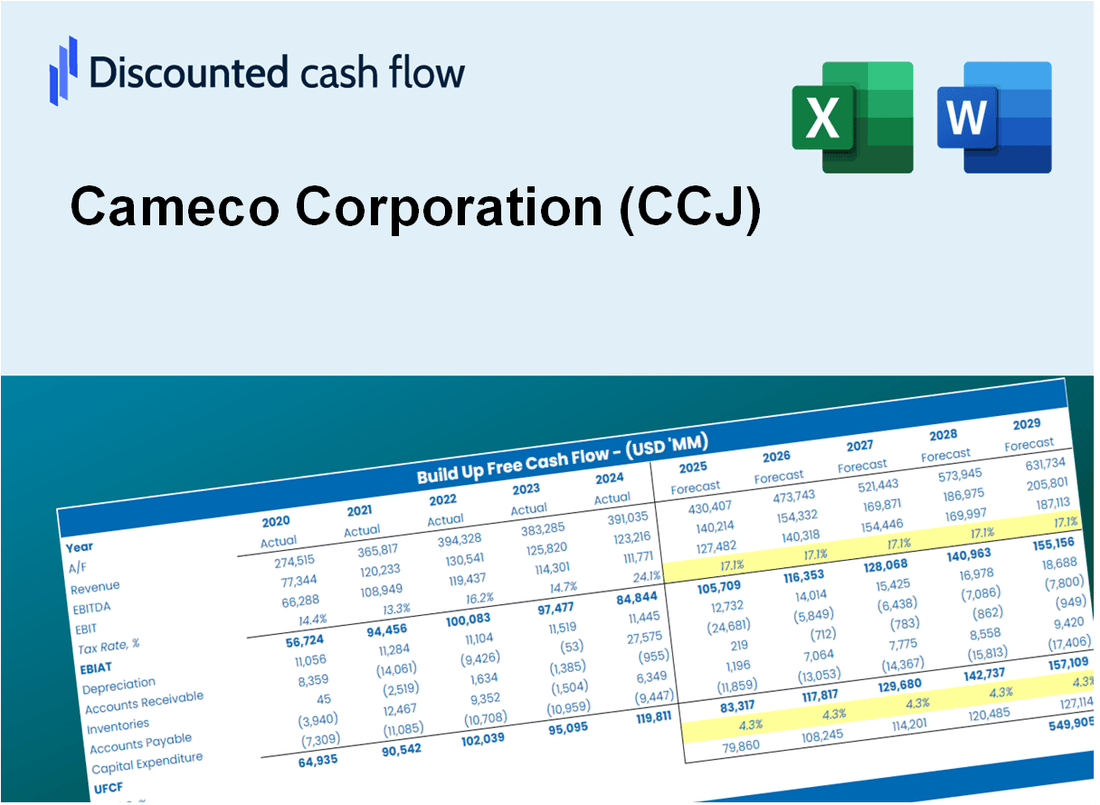
Discounted Cash Flow (DCF) - (USD MM)
| Year | AY1 2020 |
AY2 2021 |
AY3 2022 |
AY4 2023 |
AY5 2024 |
FY1 2025 |
FY2 2026 |
FY3 2027 |
FY4 2028 |
FY5 2029 |
|---|---|---|---|---|---|---|---|---|---|---|
| Revenue | 1,283.4 | 1,051.6 | 1,331.9 | 1,845.0 | 2,235.8 | 2,617.5 | 3,064.4 | 3,587.6 | 4,200.1 | 4,917.2 |
| Revenue Growth, % | 0 | -18.06 | 26.65 | 38.53 | 21.18 | 17.07 | 17.07 | 17.07 | 17.07 | 17.07 |
| EBITDA | 131.3 | 105.0 | 236.1 | 570.0 | 562.8 | 492.2 | 576.2 | 674.6 | 789.8 | 924.6 |
| EBITDA, % | 10.23 | 9.98 | 17.73 | 30.9 | 25.17 | 18.8 | 18.8 | 18.8 | 18.8 | 18.8 |
| Depreciation | 157.8 | 135.8 | 126.5 | 157.1 | 224.2 | 278.7 | 326.3 | 382.0 | 447.2 | 523.6 |
| Depreciation, % | 12.29 | 12.91 | 9.5 | 8.51 | 10.03 | 10.65 | 10.65 | 10.65 | 10.65 | 10.65 |
| EBIT | -26.4 | -30.8 | 109.7 | 413.0 | 338.6 | 213.5 | 249.9 | 292.6 | 342.5 | 401.0 |
| EBIT, % | -2.06 | -2.93 | 8.24 | 22.38 | 15.15 | 8.16 | 8.16 | 8.16 | 8.16 | 8.16 |
| Total Cash | 672.6 | 950.0 | 1,626.9 | 404.1 | 428.1 | 1,485.6 | 1,739.3 | 2,036.2 | 2,383.9 | 2,790.9 |
| Total Cash, percent | .0 | .0 | .0 | .0 | .0 | .0 | .0 | .0 | .0 | .0 |
| Account Receivables | 118.4 | 217.0 | 154.8 | 309.1 | 220.7 | 356.5 | 417.4 | 488.7 | 572.1 | 669.8 |
| Account Receivables, % | 9.22 | 20.63 | 11.63 | 16.75 | 9.87 | 13.62 | 13.62 | 13.62 | 13.62 | 13.62 |
| Inventories | 548.9 | 360.0 | 586.5 | 600.1 | 693.2 | 966.2 | 1,131.1 | 1,324.2 | 1,550.3 | 1,815.0 |
| Inventories, % | 42.76 | 34.23 | 44.04 | 32.52 | 31.01 | 36.91 | 36.91 | 36.91 | 36.91 | 36.91 |
| Accounts Payable | 97.8 | 152.1 | 178.2 | 263.0 | 92.6 | 282.0 | 330.1 | 386.5 | 452.5 | 529.7 |
| Accounts Payable, % | 7.62 | 14.47 | 13.38 | 14.25 | 4.14 | 10.77 | 10.77 | 10.77 | 10.77 | 10.77 |
| Capital Expenditure | -55.2 | -70.4 | -102.3 | -109.5 | -150.9 | -164.2 | -192.2 | -225.1 | -263.5 | -308.5 |
| Capital Expenditure, % | -4.3 | -6.7 | -7.68 | -5.94 | -6.75 | -6.27 | -6.27 | -6.27 | -6.27 | -6.27 |
| Tax Rate, % | 33.06 | 33.06 | 33.06 | 33.06 | 33.06 | 33.06 | 33.06 | 33.06 | 33.06 | 33.06 |
| EBITAT | -35.6 | -30.4 | 115.6 | 305.9 | 226.7 | 187.8 | 219.8 | 257.3 | 301.3 | 352.7 |
| Depreciation | ||||||||||
| Changes in Account Receivables | ||||||||||
| Changes in Inventories | ||||||||||
| Changes in Accounts Payable | ||||||||||
| Capital Expenditure | ||||||||||
| UFCF | -502.4 | 179.6 | 1.5 | 270.4 | 124.7 | 82.9 | 176.2 | 206.3 | 241.5 | 282.7 |
| WACC, % | 9.93 | 9.92 | 9.93 | 9.86 | 9.85 | 9.9 | 9.9 | 9.9 | 9.9 | 9.9 |
| PV UFCF | ||||||||||
| SUM PV UFCF | 718.7 | |||||||||
| Long Term Growth Rate, % | 2.00 | |||||||||
| Free cash flow (T + 1) | 288 | |||||||||
| Terminal Value | 3,651 | |||||||||
| Present Terminal Value | 2,278 | |||||||||
| Enterprise Value | 2,996 | |||||||||
| Net Debt | 496 | |||||||||
| Equity Value | 2,500 | |||||||||
| Diluted Shares Outstanding, MM | 436 | |||||||||
| Equity Value Per Share | 5.74 |
What You Will Get
- Real CCJ Financials: Access to historical and projected data for precise valuation.
- Customizable Inputs: Adjust WACC, tax rates, revenue growth, and capital expenditures as needed.
- Dynamic Calculations: Intrinsic value and NPV are computed in real-time.
- Scenario Analysis: Evaluate various scenarios to assess Cameco’s future performance.
- User-Friendly Design: Designed for professionals while remaining approachable for newcomers.
Key Features
- Accurate Cameco Financials: Gain access to reliable pre-loaded historical data and future forecasts.
- Adjustable Forecast Parameters: Modify highlighted cells, including WACC, growth rates, and profit margins.
- Real-Time Calculations: Automatic updates for DCF, Net Present Value (NPV), and cash flow assessments.
- Interactive Dashboard: User-friendly charts and summaries to help visualize your valuation outcomes.
- Designed for All Skill Levels: An intuitive layout tailored for investors, CFOs, and consultants alike.
How It Works
- Download: Obtain the pre-configured Excel file containing Cameco Corporation’s (CCJ) financial data.
- Customize: Modify projections, including revenue growth, EBITDA %, and WACC as needed.
- Update Automatically: The intrinsic value and NPV calculations refresh in real-time.
- Test Scenarios: Develop various projections and immediately compare the results.
- Make Decisions: Leverage the valuation outcomes to inform your investment strategy.
Why Choose Cameco Corporation (CCJ)?
- Industry Leader: A trusted name in the uranium sector with a proven track record.
- Commitment to Sustainability: Focused on responsible mining practices and environmental stewardship.
- Innovative Solutions: Pioneering advancements in nuclear technology and energy production.
- Strong Financial Performance: Consistent growth and solid returns for investors.
- Expertise and Experience: A team of professionals dedicated to excellence in the nuclear industry.
Who Should Use This Product?
- Individual Investors: Make informed decisions about buying or selling Cameco Corporation (CCJ) stock.
- Financial Analysts: Streamline valuation processes with ready-to-use financial models for Cameco Corporation (CCJ).
- Consultants: Deliver professional valuation insights on Cameco Corporation (CCJ) to clients quickly and accurately.
- Business Owners: Understand how large companies like Cameco Corporation (CCJ) are valued to guide your own strategy.
- Finance Students: Learn valuation techniques using real-world data and scenarios related to Cameco Corporation (CCJ).
What the Template Contains
- Historical Data: Includes Cameco Corporation’s past financials and baseline forecasts.
- DCF and Levered DCF Models: Detailed templates to calculate Cameco Corporation’s intrinsic value.
- WACC Sheet: Pre-built calculations for Weighted Average Cost of Capital.
- Editable Inputs: Modify key drivers like growth rates, EBITDA %, and CAPEX assumptions.
- Quarterly and Annual Statements: A complete breakdown of Cameco Corporation’s financials.
- Interactive Dashboard: Visualize valuation results and projections dynamically.
Disclaimer
All information, articles, and product details provided on this website are for general informational and educational purposes only. We do not claim any ownership over, nor do we intend to infringe upon, any trademarks, copyrights, logos, brand names, or other intellectual property mentioned or depicted on this site. Such intellectual property remains the property of its respective owners, and any references here are made solely for identification or informational purposes, without implying any affiliation, endorsement, or partnership.
We make no representations or warranties, express or implied, regarding the accuracy, completeness, or suitability of any content or products presented. Nothing on this website should be construed as legal, tax, investment, financial, medical, or other professional advice. In addition, no part of this site—including articles or product references—constitutes a solicitation, recommendation, endorsement, advertisement, or offer to buy or sell any securities, franchises, or other financial instruments, particularly in jurisdictions where such activity would be unlawful.
All content is of a general nature and may not address the specific circumstances of any individual or entity. It is not a substitute for professional advice or services. Any actions you take based on the information provided here are strictly at your own risk. You accept full responsibility for any decisions or outcomes arising from your use of this website and agree to release us from any liability in connection with your use of, or reliance upon, the content or products found herein.