
|
Compagnie des Alpes SA (CDA.PA) DCF Valuation |
Fully Editable: Tailor To Your Needs In Excel Or Sheets
Professional Design: Trusted, Industry-Standard Templates
Investor-Approved Valuation Models
MAC/PC Compatible, Fully Unlocked
No Expertise Is Needed; Easy To Follow
Compagnie des Alpes SA (CDA.PA) Bundle
Looking to assess the intrinsic value of Compagnie des Alpes SA? Our (CDAPA) DCF Calculator integrates real-world data with extensive customization features, enabling you to refine your forecasts and enhance your investment choices.
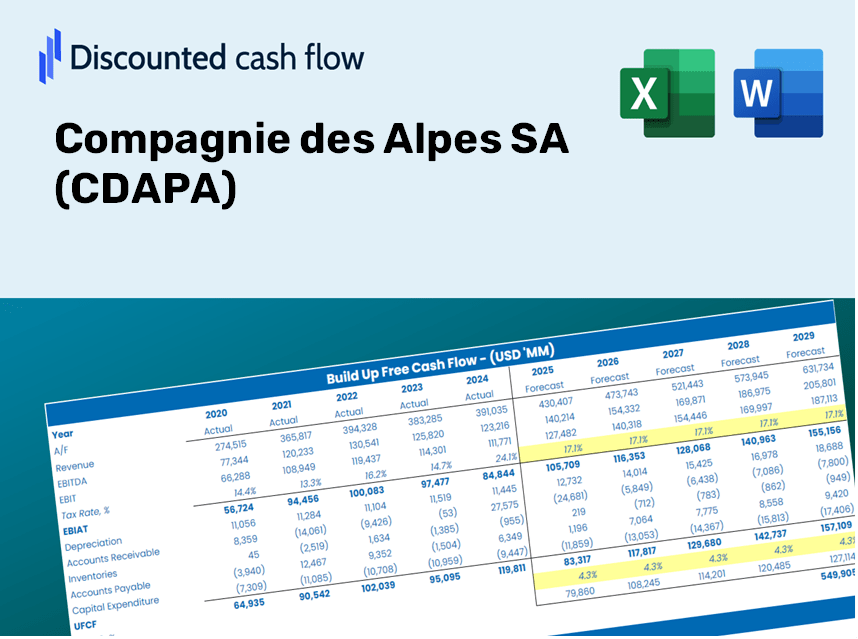
Discounted Cash Flow (DCF) - (USD MM)
| Year | AY1 2020 |
AY2 2021 |
AY3 2022 |
AY4 2023 |
AY5 2024 |
FY1 2025 |
FY2 2026 |
FY3 2027 |
FY4 2028 |
FY5 2029 |
|---|---|---|---|---|---|---|---|---|---|---|
| Revenue | 615.6 | 240.6 | 958.5 | 1,125.5 | 1,239.2 | 1,445.6 | 1,686.2 | 1,967.0 | 2,294.5 | 2,676.6 |
| Revenue Growth, % | 0 | -60.92 | 298.44 | 17.41 | 10.11 | 16.65 | 16.65 | 16.65 | 16.65 | 16.65 |
| EBITDA | 104.5 | 7.6 | 310.1 | 314.9 | 356.6 | 315.8 | 368.4 | 429.7 | 501.2 | 584.7 |
| EBITDA, % | 16.97 | 3.15 | 32.35 | 27.98 | 28.78 | 21.84 | 21.84 | 21.84 | 21.84 | 21.84 |
| Depreciation | 148.4 | 140.0 | 143.4 | 172.1 | 192.6 | 370.4 | 432.0 | 504.0 | 587.9 | 685.8 |
| Depreciation, % | 24.11 | 58.21 | 14.96 | 15.29 | 15.54 | 25.62 | 25.62 | 25.62 | 25.62 | 25.62 |
| EBIT | -43.9 | -132.5 | 166.7 | 142.8 | 164.1 | -54.6 | -63.7 | -74.3 | -86.7 | -101.1 |
| EBIT, % | -7.14 | -55.06 | 17.39 | 12.69 | 13.24 | -3.78 | -3.78 | -3.78 | -3.78 | -3.78 |
| Total Cash | 16.6 | 350.0 | 304.1 | 111.5 | 234.3 | 472.0 | 550.5 | 642.2 | 749.1 | 873.9 |
| Total Cash, percent | .0 | .0 | .0 | .0 | .0 | .0 | .0 | .0 | .0 | .0 |
| Account Receivables | 56.6 | 17.9 | 86.3 | 1.6 | 68.9 | 90.7 | 105.8 | 123.4 | 143.9 | 167.9 |
| Account Receivables, % | 9.2 | 7.45 | 9.01 | 0.14607 | 5.56 | 6.27 | 6.27 | 6.27 | 6.27 | 6.27 |
| Inventories | 23.2 | 21.5 | 23.4 | 28.0 | 31.3 | 58.3 | 68.0 | 79.3 | 92.5 | 107.9 |
| Inventories, % | 3.76 | 8.94 | 2.44 | 2.49 | 2.53 | 4.03 | 4.03 | 4.03 | 4.03 | 4.03 |
| Accounts Payable | 182.6 | 81.0 | 108.8 | 111.7 | 171.1 | 284.5 | 331.9 | 387.1 | 451.6 | 526.8 |
| Accounts Payable, % | 29.66 | 33.67 | 11.35 | 9.92 | 13.81 | 19.68 | 19.68 | 19.68 | 19.68 | 19.68 |
| Capital Expenditure | -177.9 | -146.5 | -191.4 | -246.1 | -270.1 | -443.5 | -517.4 | -603.5 | -704.0 | -821.2 |
| Capital Expenditure, % | -28.9 | -60.88 | -19.97 | -21.87 | -21.8 | -30.68 | -30.68 | -30.68 | -30.68 | -30.68 |
| Tax Rate, % | 23.08 | 23.08 | 23.08 | 23.08 | 23.08 | 23.08 | 23.08 | 23.08 | 23.08 | 23.08 |
| EBITAT | -37.0 | -112.1 | 118.2 | 105.9 | 126.2 | -42.7 | -49.8 | -58.1 | -67.7 | -79.0 |
| Depreciation | ||||||||||
| Changes in Account Receivables | ||||||||||
| Changes in Inventories | ||||||||||
| Changes in Accounts Payable | ||||||||||
| Capital Expenditure | ||||||||||
| UFCF | 36.4 | -179.8 | 27.8 | 114.7 | 37.6 | -51.2 | -112.6 | -131.3 | -153.2 | -178.7 |
| WACC, % | 5.92 | 5.93 | 5.65 | 5.72 | 5.77 | 5.8 | 5.8 | 5.8 | 5.8 | 5.8 |
| PV UFCF | ||||||||||
| SUM PV UFCF | -516.9 | |||||||||
| Long Term Growth Rate, % | 0.50 | |||||||||
| Free cash flow (T + 1) | -180 | |||||||||
| Terminal Value | -3,389 | |||||||||
| Present Terminal Value | -2,556 | |||||||||
| Enterprise Value | -3,073 | |||||||||
| Net Debt | 1,263 | |||||||||
| Equity Value | -4,336 | |||||||||
| Diluted Shares Outstanding, MM | 51 | |||||||||
| Equity Value Per Share | -84.97 |
What You Will Get
- Pre-Filled Financial Model: Utilizes Compagnie des Alpes SA’s actual data for accurate DCF valuation.
- Full Forecast Control: Modify revenue growth, profit margins, WACC, and other essential metrics.
- Instant Calculations: Automatic updates provide real-time results as adjustments are made.
- Investor-Ready Template: A polished Excel document crafted for professional valuation.
- Customizable and Reusable: Designed for adaptability, enabling repeated use for comprehensive forecasts.
Key Features
- Pre-Loaded Data: Compagnie des Alpes’ historical financial statements and pre-filled forecasts.
- Fully Adjustable Inputs: Customize WACC, tax rates, revenue growth, and EBITDA margins to fit your analysis.
- Instant Results: View the intrinsic value of Compagnie des Alpes (CDAPA) recalculating in real time.
- Clear Visual Outputs: Dashboard charts present valuation results and key financial metrics clearly.
- Built for Accuracy: A professional-grade tool designed for analysts, investors, and finance professionals.
How It Functions
- Download: Obtain the pre-built Excel file featuring Compagnie des Alpes SA’s (CDAPA) financial information.
- Customize: Modify forecasts, such as revenue growth, EBITDA percentage, and WACC.
- Update Automatically: Watch as intrinsic value and NPV calculations refresh in real-time.
- Test Scenarios: Generate various projections and instantly compare the results.
- Make Decisions: Utilize the valuation findings to inform your investment strategy.
Why Opt for the Compagnie des Alpes SA (CDAPA) Calculator?
- All-in-One Solution: Combines DCF, WACC, and financial ratio analyses in a single tool.
- Flexible Inputs: Modify the yellow-highlighted cells to explore different scenarios.
- In-Depth Analysis: Automatically determines the intrinsic value and Net Present Value for Compagnie des Alpes SA (CDAPA).
- Preloaded Information: Including historical and projected data for precise calculations.
- High-Quality Standards: Perfect for financial analysts, investors, and business consultants.
Who Can Benefit from This Product?
- Investors: Evaluate Compagnie des Alpes SA’s (CDAPA) valuation prior to making stock transactions.
- CFOs and Financial Analysts: Enhance valuation workflows and validate financial forecasts.
- Startup Founders: Gain insights into how leading companies like Compagnie des Alpes SA are appraised.
- Consultants: Create comprehensive valuation reports for your clients.
- Students and Educators: Leverage real-life data to practice and instruct on valuation methodologies.
Contents of the Template
- Pre-Filled Data: Contains Compagnie des Alpes SA’s historical financial figures and forecasts.
- Discounted Cash Flow Model: An editable DCF valuation model featuring automatic calculations.
- Weighted Average Cost of Capital (WACC): A specific sheet for calculating WACC based on user-defined inputs.
- Key Financial Ratios: Evaluate Compagnie des Alpes SA’s profitability, efficiency, and leverage metrics.
- Customizable Inputs: Easily modify assumptions for revenue growth, margins, and tax rates.
- Clear Dashboard: Visuals and tables that summarize essential valuation outcomes.
Disclaimer
All information, articles, and product details provided on this website are for general informational and educational purposes only. We do not claim any ownership over, nor do we intend to infringe upon, any trademarks, copyrights, logos, brand names, or other intellectual property mentioned or depicted on this site. Such intellectual property remains the property of its respective owners, and any references here are made solely for identification or informational purposes, without implying any affiliation, endorsement, or partnership.
We make no representations or warranties, express or implied, regarding the accuracy, completeness, or suitability of any content or products presented. Nothing on this website should be construed as legal, tax, investment, financial, medical, or other professional advice. In addition, no part of this site—including articles or product references—constitutes a solicitation, recommendation, endorsement, advertisement, or offer to buy or sell any securities, franchises, or other financial instruments, particularly in jurisdictions where such activity would be unlawful.
All content is of a general nature and may not address the specific circumstances of any individual or entity. It is not a substitute for professional advice or services. Any actions you take based on the information provided here are strictly at your own risk. You accept full responsibility for any decisions or outcomes arising from your use of this website and agree to release us from any liability in connection with your use of, or reliance upon, the content or products found herein.