
|
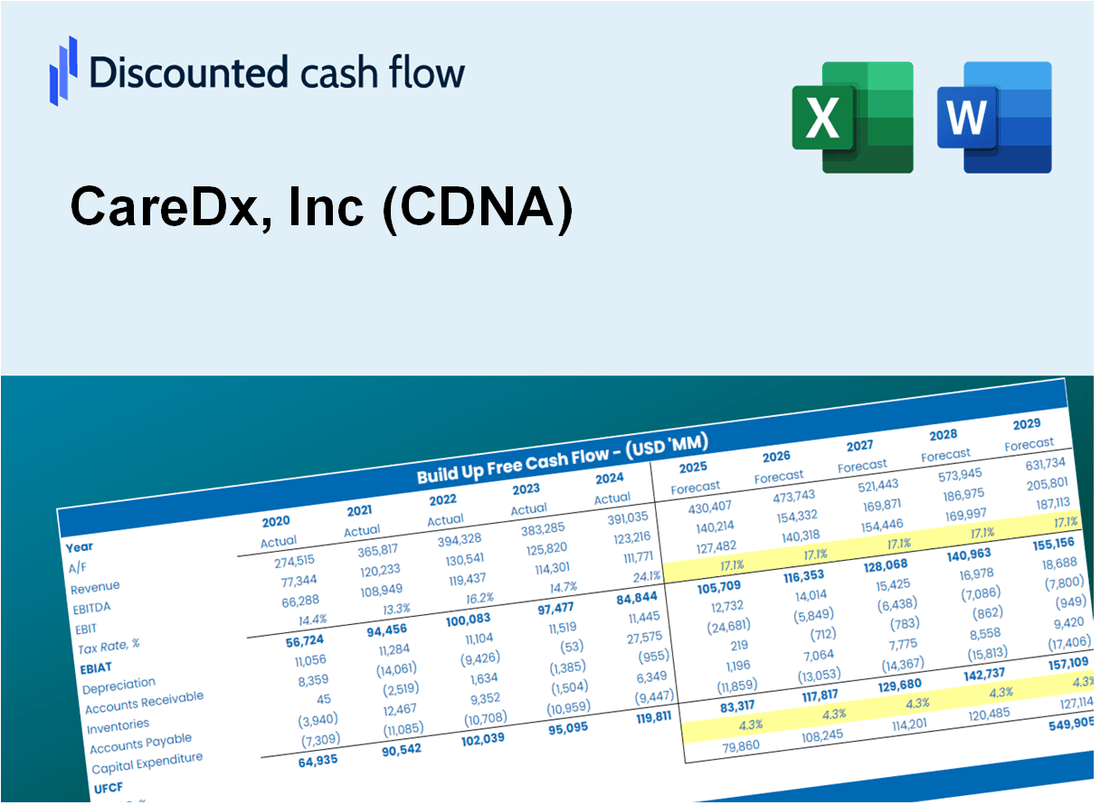
CareDx, Inc (CDNA) DCF Valuation |
Fully Editable: Tailor To Your Needs In Excel Or Sheets
Professional Design: Trusted, Industry-Standard Templates
Investor-Approved Valuation Models
MAC/PC Compatible, Fully Unlocked
No Expertise Is Needed; Easy To Follow
CareDx, Inc (CDNA) Bundle
Designed for accuracy, our CareDx, Inc (CDNA) DCF Calculator enables you to evaluate CareDx’s valuation using actual financial data and offers complete flexibility to modify all key parameters for improved forecasting.
What You Will Receive
- Adjustable Forecast Parameters: Effortlessly modify assumptions (growth %, margins, WACC) to explore various scenarios.
- Comprehensive Data: CareDx's financial information pre-loaded to facilitate your analysis.
- Instant DCF Calculations: The template automatically computes Net Present Value (NPV) and intrinsic value for you.
- Tailored and Professional: A refined Excel model designed to meet your valuation requirements.
- Designed for Analysts and Investors: Perfect for assessing projections, validating strategies, and enhancing efficiency.
Key Features
- Comprehensive CDNA Data: Pre-filled with CareDx, Inc’s historical performance metrics and future forecasts.
- Customizable Financial Inputs: Modify revenue growth rates, profit margins, discount rates, tax assumptions, and capital investments.
- Interactive Valuation Model: Instant updates to Net Present Value (NPV) and intrinsic value as per your adjustments.
- Scenario Analysis: Develop various forecasting scenarios to evaluate different valuation results.
- Intuitive User Interface: Clean, organized layout designed for both professionals and novices.
How It Works
- Step 1: Download the prebuilt Excel template featuring CareDx, Inc's (CDNA) data.
- Step 2: Navigate through the pre-filled sheets to grasp the essential metrics.
- Step 3: Modify forecasts and assumptions in the editable yellow cells (WACC, growth, margins).
- Step 4: Instantly see the recalculated results, including CareDx, Inc's (CDNA) intrinsic value.
- Step 5: Utilize the outputs to make informed investment decisions or create reports.
Why Choose the CareDx Calculator?
- Accuracy: Utilizes real CareDx financials to ensure precise data.
- Flexibility: Allows users to easily test and adjust inputs as needed.
- Time-Saving: Eliminate the complexity of creating a DCF model from the ground up.
- Professional-Grade: Crafted with CFO-level accuracy and user experience in focus.
- User-Friendly: Designed for accessibility, even for those with limited financial modeling knowledge.
Who Should Use This Product?
- Healthcare Investors: Develop comprehensive valuation models for assessing CareDx, Inc (CDNA) investment opportunities.
- Corporate Strategy Teams: Evaluate valuation scenarios to inform strategic decisions within healthcare organizations.
- Consultants and Advisors: Deliver precise valuation insights for clients interested in CareDx, Inc (CDNA).
- Students and Educators: Utilize real-world data to enhance learning and practice in financial modeling related to healthcare.
- Biotech Enthusiasts: Gain insights into how biotech firms like CareDx, Inc (CDNA) are valued in the industry.
What the Template Contains
- Historical Data: Includes CareDx’s past financials and baseline forecasts.
- DCF and Levered DCF Models: Detailed templates to calculate CareDx’s intrinsic value.
- WACC Sheet: Pre-built calculations for Weighted Average Cost of Capital.
- Editable Inputs: Modify key drivers like growth rates, EBITDA %, and CAPEX assumptions.
- Quarterly and Annual Statements: A complete breakdown of CareDx’s financials.
- Interactive Dashboard: Visualize valuation results and projections dynamically.
Disclaimer
All information, articles, and product details provided on this website are for general informational and educational purposes only. We do not claim any ownership over, nor do we intend to infringe upon, any trademarks, copyrights, logos, brand names, or other intellectual property mentioned or depicted on this site. Such intellectual property remains the property of its respective owners, and any references here are made solely for identification or informational purposes, without implying any affiliation, endorsement, or partnership.
We make no representations or warranties, express or implied, regarding the accuracy, completeness, or suitability of any content or products presented. Nothing on this website should be construed as legal, tax, investment, financial, medical, or other professional advice. In addition, no part of this site—including articles or product references—constitutes a solicitation, recommendation, endorsement, advertisement, or offer to buy or sell any securities, franchises, or other financial instruments, particularly in jurisdictions where such activity would be unlawful.
All content is of a general nature and may not address the specific circumstances of any individual or entity. It is not a substitute for professional advice or services. Any actions you take based on the information provided here are strictly at your own risk. You accept full responsibility for any decisions or outcomes arising from your use of this website and agree to release us from any liability in connection with your use of, or reliance upon, the content or products found herein.