
|
Celanese Corporation (CE): BCG Matrix [Dec-2025 Updated] |
Fully Editable: Tailor To Your Needs In Excel Or Sheets
Professional Design: Trusted, Industry-Standard Templates
Investor-Approved Valuation Models
MAC/PC Compatible, Fully Unlocked
No Expertise Is Needed; Easy To Follow
Celanese Corporation (CE) Bundle
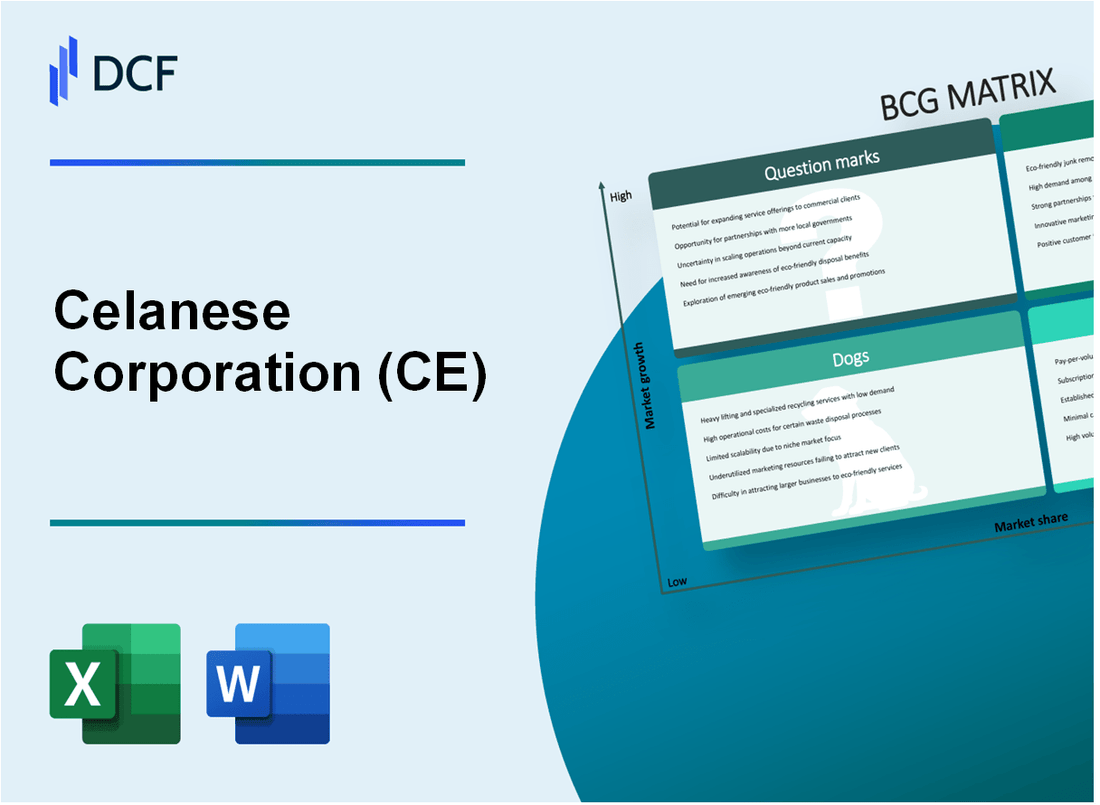
You're looking for a clear map of Celanese Corporation's portfolio, so let's break down their core businesses into the four BCG quadrants as of late 2025. The Acetyl Chain is your dependable Cash Cow, delivering $196 \text{ million}$ in adjusted EBIT in Q2 2025 to fund the future, while High Impact Programs in Engineered Materials are the clear Stars driving innovation. Still, we have Dogs like the Acetate Tow business facing closures and Question Marks like the broader M&M integration, which needs heavy investment despite the $500 \text{ million}$ divestiture planned for other assets. Let's see precisely where Celanese is allocating capital to hit that $700-$800 \text{ million}$ free cash flow target.
Background of Celanese Corporation (CE)
You're looking at Celanese Corporation (CE), a global leader in the chemical and specialty materials space, headquartered in Dallas. Honestly, they're a big player, producing engineered materials and acetyl chain products that feed into diverse sectors like automotive, medical, and construction. As of late 2025, the company is navigating a complex environment, focusing heavily on financial discipline to restore its growth trajectory.
To give you a sense of scale, Celanese Corporation reported net sales of approximately $10.3 billion and operating EBITDA of $2.4 billion for the full year 2024. Looking at the more recent quarterly data, the third quarter of 2025 saw net sales come in at $2.4 billion, reflecting a sequential decline driven by lower volume and price across key end-markets. The operational results for that quarter showed an operating EBITDA of $517 million, with an operating margin of 21 percent.
Financially, the company has been under pressure, which is reflected in some of the reported figures. For instance, the third quarter of 2025 resulted in a U.S. GAAP diluted loss per share of ($12.39), largely due to a significant non-cash goodwill impairment loss in the Engineered Materials reporting segment, which carries an accumulated goodwill impairment of $1.5 billion on the balance sheet. Still, management is driving hard on cash flow, targeting $700 million to $800 million in free cash flow for 2025, a notable increase from the $531 million generated in 2024.
Strategically, Celanese Corporation is executing several key moves to improve its standing. They are intensely focused on deleveraging the balance sheet and driving top-line growth through differentiated business models. A major part of this strategy involves portfolio optimization; for example, they signed an agreement to divest the Micromax® business for about $500 million, with net proceeds dedicated to debt reduction. Furthermore, the company has a clear goal to increase its specialty materials revenue mix to 65% by 2026, up from 55% currently, showing a definite pivot toward higher-value products.
If you look at the market sentiment as of late 2025, the stock has some interesting valuation signals. The Price-to-Sales (P/S) ratio sits at 0.45, and the Price-to-Book (P/B) ratio is 0.82, both near 10-year lows, suggesting some analysts see potential undervaluation. The market capitalization was noted around $4.35 billion in November 2025. This financial picture, combined with the ongoing strategic realignment, sets the stage for how we'll map their business units next.
Celanese Corporation (CE) - BCG Matrix: Stars
The Stars quadrant represents Celanese Corporation's business units or product lines operating in high-growth markets with a strong relative market share. These areas require significant investment to maintain their leadership position and are expected to transition into Cash Cows as market growth moderates.
High Impact Programs (HIPs) in Engineered Materials (EM) targeting EVs and medical represent a core area of Star focus. The medical segment is a high-growth area; the global medical engineered materials market is estimated to be valued at approximately $29.12 Billion in 2025, with a projected Compound Annual Growth Rate (CAGR) of 13.75% through 2032. Celanese's specialized high-performance polymers are designed for these rigorous medical applications, ensuring biocompatibility and processability for devices and implants. Furthermore, the Engineered Materials business is heavily focused on supporting the electric vehicle market, a key driver of growth, as evidenced by the capabilities housed in the expanded Asia Technology Center (ATC).
The specialty polymers and elastomers gained from the 2022 M&M acquisition are central to Celanese Corporation's Star portfolio, driving high-performance applications. This acquisition, completed for $11.0 billion in cash, significantly enhanced the EM product portfolio by adding industry-renowned brands, new polymers, and backward integration in critical areas. Management anticipated that once full synergies were achieved by 2026, the acquisition would contribute an accretion of $4.00 or more per share to adjusted earnings per share, alongside expected run-rate synergies of approximately $450 million. These materials, including engineered thermoplastics and elastomers, are key to maintaining market leadership in demanding sectors.
Focused growth in the Asia Technology Center (ATC) is designed to accelerate innovation in these high-growth regional markets. The expanded ATC, unveiled in October 2024, brings together world-class capabilities in product design, advanced analytics, and part testing to support both the Acetyl Chain and Engineered Materials businesses, specifically targeting fast-moving sectors like electric vehicles. The center houses specialized labs, including a comprehensive elastomer processing laboratory, which helps fasten new product development and validation speed for customers in Asia and globally.
The expected financial payoff from these growth drivers is quantified in the forward-looking guidance. Management has expressed confidence in achieving a significant uplift from these programs. Here's the quick math on the expected impact:
| Metric | Value/Range | Timeframe/Context |
| 2026 EPS Growth Target | $1 to $2 per share uplift | Expected from cost actions and High-Impact Program growth |
| Q3 2025 Adjusted EPS | $1.34 | Most recent reported performance |
| 2025 Free Cash Flow Guidance | $700 million to $800 million | Focus for the fiscal year |
| M&M Synergy Target | $450 million (run-rate) | Expected within four years of the 2022 close |
These Stars are consuming cash to fuel their growth, but the investment is targeted at maintaining market share in expanding segments. For instance, the recent Q3 2025 Adjusted EPS was $1.34, while the guidance for Q4 2025 was set between $0.850 and $1.000 EPS. The strategy is clear: invest heavily now to secure future Cash Cow status.
The innovation pipeline supporting these Stars includes several key actions:
- Launch of new features for the Chemille® Digital Assistant, an AI-powered platform to accelerate material selection.
- Introduction of new specialty materials at the K Show in October 2025.
- Development of new ECO-B formulations with bio-based content for Zytel® HTN and Zytel® PA solutions.
- Launch of Forton® PPS ECO-R reinforced with recycled glass fiber.
If onboarding takes 14+ days, churn risk rises, but for Celanese Corporation, the risk is more about maintaining the pace of innovation to keep these segments as Stars. Finance: draft 13-week cash view by Friday.
Celanese Corporation (CE) - BCG Matrix: Cash Cows
You're looking at the core engine of Celanese Corporation's current financial stability, the Acetyl Chain (AC) segment. This business unit operates in a mature space, holding a cost-advantaged global leadership position in key products like acetic acid and vinyl acetate monomer (VAM). It's the unit that generates the excess cash needed to fund the rest of the corporation's strategy.
Even facing demand headwinds, the segment delivered consistently strong earnings in the second quarter of 2025. Here's a quick look at that performance:
| Metric | Value (Q2 2025) |
| Net Sales | $1.1 billion |
| Adjusted EBIT | $196 million |
| Operating EBITDA | $260 million |
| Adjusted EBIT Margin | 18 percent |
This segment is definitely the primary source of cash flow right now. The cash generated here is crucial; it's what's supporting the full-year 2025 free cash flow target, which Celanese Corporation is aiming to keep in the range of $700 to $800 million. That cash is earmarked for deleveraging the balance sheet, which is a top priority for management.
To maintain this strong cash-generating status, the focus isn't on massive growth spending, but on efficiency and milking the existing advantage. You see this reflected in the segment's operational focus:
- Optimizing production at low-cost, U.S. based assets.
- Reducing operating rates at higher cost sites globally.
- Driving consistency of earnings through cost control.
- Maintaining high market share in mature chemical chains.
Also, the strategy involves leaning into the more stable, higher-value parts of the chain. On a global basis, about 65% of the company's acetyls sales come from downstream applications-products that aren't just the base acetic acid or VAM. These downstream sales, like those into emulsions and resins, generally offer more stable revenue streams, helping to buffer the volatility of the commodity side of the business. It's smart management of a mature asset, honestly.
Celanese Corporation (CE) - BCG Matrix: Dogs
You're looking at the parts of Celanese Corporation (CE) that aren't pulling their weight in terms of growth and market share, the classic Dogs. These are the businesses where cash is often trapped, and expensive fixes rarely pay off, so divestiture becomes the logical next step.
The Acetate Tow business definitely fits this profile, facing persistent weak demand and structural over-supply in the market. You see this play out in the strategic decisions Celanese is making to exit certain high-cost operations. For instance, the company announced its intent to cease operations at the Lanaken, Belgium, acetate tow facility during the second half of 2026, citing declining demand and high operating costs. That specific closure may impact approximately 160 employees. This unit generated approximately $700 million in revenue back in 2023, but the current environment is clearly challenging.
Here's a quick look at the financial context for these challenged areas based on the latest available figures:
| Business Unit/Asset | Latest Reported Revenue/Sales Figure | Latest Reported Volume Change | Action/Status |
| Micromax® Portfolio | Divestiture proceeds of approximately $500 million | N/A (Divested) | Definitive agreement signed for divestiture |
| Acetate Tow (Implied Segment) | Acetyl Chain Q3 2025 Net Sales: $1.1 billion | Acetate tow orders saw anticipated delays in Q1 2025 | Lanaken facility closure announced for H2 2026 |
| Standard-Grade Engineered Thermoplastics | Engineered Materials Q3 2025 Net Sales: $1.4 billion | Engineered Materials Q3 2025 Volume: 6 percent decrease (sequential) | Full Year 2024 Engineered Materials volume declined 5 percent |
The active divestiture of the Micromax® electronic inks and paste portfolio is a clear move to shed a low-growth asset and generate cash. Celanese signed a definitive agreement to receive approximately $500 million in cash from this sale, with proceeds dedicated to paying down debt. The transaction is slated to close in the first quarter of 2026.
For standard-grade engineered thermoplastics, like POM and Nylon, you are seeing the impact of weak end-markets reflected in the volume data. The Engineered Materials segment, which houses these products, saw its net sales fall to $1.4 billion in the third quarter of 2025, driven by a 6 percent decrease in volume compared to the previous quarter. This follows a 5 percent decline in volume for the entire Engineered Materials segment for the full year 2024.
These Dogs are being managed through specific, decisive actions:
- The Micromax® divestiture is set to generate $500 million in cash proceeds.
- The Lanaken acetate tow unit closure is scheduled for the second half of 2026.
- The company is executing cost reduction targets, having completed actions to exceed the targeted $75 million in SG&A reductions announced previously.
- The Engineered Materials business is focused on reducing inventory by approximately $100 million in 2025 to support cash generation.
Celanese Corporation (CE) - BCG Matrix: Question Marks
You're looking at those business units that are operating in high-growth markets but haven't yet captured a significant market share. For Celanese Corporation, these are the areas that demand significant cash infusion to push them toward Star status, or risk them becoming Dogs if they stall. The latest data from the third quarter of 2025 clearly shows where this cash burn and potential struggle is concentrated.
The Engineered Materials (EM) portfolio is a prime example of a Question Mark. While EM is a key strategic area, its recent performance indicates the need for heavy investment to translate potential into market dominance. For Q3 2025, the segment reported net sales of $1.4 billion, but this was accompanied by a sequential volume decrease of 6%. This dynamic-sales in a growing specialty area but with declining volume-is the textbook definition of a Question Mark consuming cash.
The integration of the Mobility & Materials (M&M) business, acquired for $11.0 billion, falls squarely into this category. It is a large, high-potential asset that requires heavy investment to fully integrate and realize its intended market share gains. The company is banking on significant returns, expecting run-rate synergies of approximately $450 million within the first four years, with full synergy accretion anticipated by 2026. To fund this and other priorities, Celanese is actively streamlining, evidenced by the definitive agreement to divest the Micromax® portfolio for approximately $500 million.
Here's a quick look at the financial context surrounding the EM segment in Q3 2025:
| Metric | Value (Q3 2025) | Comparison/Context |
| Engineered Materials Net Sales | $1.4 billion | Sequential decrease of 4% from Q2 2025 |
| Engineered Materials Volume Change | -6% | Sequential volume decrease |
| Engineered Materials Adjusted EBIT | $200 million | Margin of 14% |
| M&M Acquisition Cost | $11.0 billion | Purchase price for the majority of the business |
| Micromax® Divestiture Price | Approx. $500 million | Transaction price for the divested portfolio |
Beyond the EM segment's overall volume pressure, specific product lines and geographies within Celanese Corporation are exhibiting the classic Question Mark symptoms of struggling volume and price realization, requiring a focused investment or divestment decision.
The struggles are evident across several areas:
- The broader Acetyl Chain, which houses the vinyls business, saw a sequential net sales decrease of 5% in Q3 2025.
- This Acetyl Chain decline was driven by a 4% decline in price and a 2% decrease in volume.
- The vinyls business in the Western Hemisphere specifically faced demand headwinds, with CEO commentary noting that acetyl demand in that region was at the lowest levels in twenty years as of Q2 2025.
- The company is actively working on cost reductions and inventory alignment, as seen by the goal to reduce inventory in Engineered Materials by approximately $100 million in 2025 to support cash generation.
For you, the analyst, these numbers suggest that the strategy for these assets must be aggressive. You either commit the capital to rapidly grow market share in EM and turn those volume declines around, or you continue the portfolio optimization, like the Micromax® sale, to free up cash for the core Stars. The vinyls business, despite its current low demand, is flagged as a target for pricing and volume improvements, meaning it's not yet a Dog, but it's definitely burning cash waiting for a market rebound.
Disclaimer
All information, articles, and product details provided on this website are for general informational and educational purposes only. We do not claim any ownership over, nor do we intend to infringe upon, any trademarks, copyrights, logos, brand names, or other intellectual property mentioned or depicted on this site. Such intellectual property remains the property of its respective owners, and any references here are made solely for identification or informational purposes, without implying any affiliation, endorsement, or partnership.
We make no representations or warranties, express or implied, regarding the accuracy, completeness, or suitability of any content or products presented. Nothing on this website should be construed as legal, tax, investment, financial, medical, or other professional advice. In addition, no part of this site—including articles or product references—constitutes a solicitation, recommendation, endorsement, advertisement, or offer to buy or sell any securities, franchises, or other financial instruments, particularly in jurisdictions where such activity would be unlawful.
All content is of a general nature and may not address the specific circumstances of any individual or entity. It is not a substitute for professional advice or services. Any actions you take based on the information provided here are strictly at your own risk. You accept full responsibility for any decisions or outcomes arising from your use of this website and agree to release us from any liability in connection with your use of, or reliance upon, the content or products found herein.