
|
Bristol-Myers Squibb Company Ce (CELG-RI) DCF Valuation |
Fully Editable: Tailor To Your Needs In Excel Or Sheets
Professional Design: Trusted, Industry-Standard Templates
Investor-Approved Valuation Models
MAC/PC Compatible, Fully Unlocked
No Expertise Is Needed; Easy To Follow
Bristol-Myers Squibb Company Ce (CELG-RI) Bundle
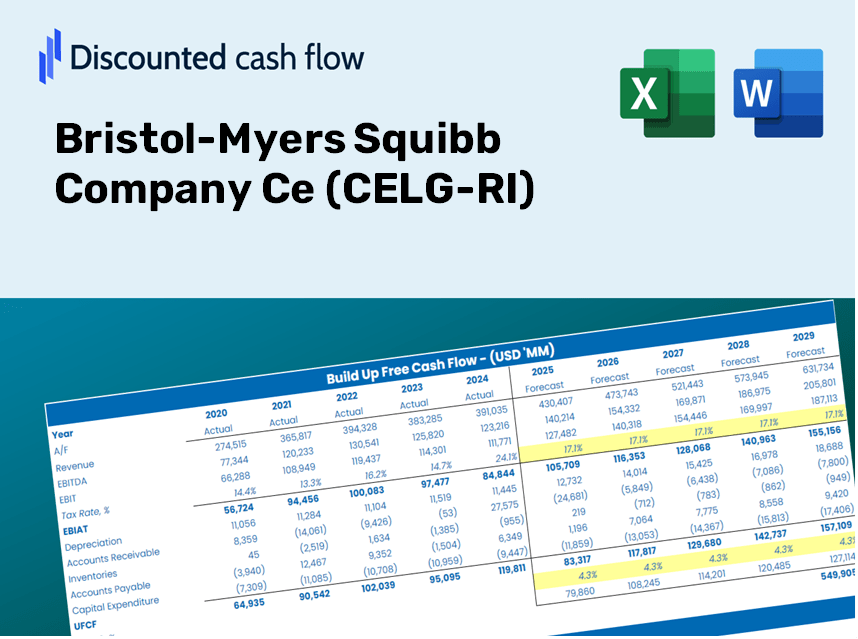
Gain mastery over your Bristol-Myers Squibb Company (CELG-RI) valuation analysis using our sophisticated DCF Calculator! Preloaded with real (CELG-RI) data, this Excel template enables you to adjust forecasts and assumptions to accurately calculate the intrinsic value of Bristol-Myers Squibb Company.
Discounted Cash Flow (DCF) - (USD MM)
| Year | AY1 2020 |
AY2 2021 |
AY3 2022 |
AY4 2023 |
AY5 2024 |
FY1 2025 |
FY2 2026 |
FY3 2027 |
FY4 2028 |
FY5 2029 |
|---|---|---|---|---|---|---|---|---|---|---|
| Revenue | 42,518.0 | 46,385.0 | 46,159.0 | 45,006.0 | 48,300.0 | 52,405.1 | 56,859.0 | 61,691.5 | 66,934.7 | 72,623.5 |
| Revenue Growth, % | 0 | 9.09 | -0.48723 | -2.5 | 7.32 | 8.5 | 8.5 | 8.5 | 8.5 | 8.5 |
| EBITDA | 4,929.0 | 20,118.0 | 19,221.0 | 19,366.0 | 3,168.0 | 15,322.6 | 16,624.9 | 18,037.9 | 19,570.9 | 21,234.3 |
| EBITDA, % | 11.59 | 43.37 | 41.64 | 43.03 | 6.56 | 29.24 | 29.24 | 29.24 | 29.24 | 29.24 |
| Depreciation | 10,380.0 | 10,686.0 | 10,276.0 | 9,760.0 | 9,600.0 | 11,662.7 | 12,653.9 | 13,729.4 | 14,896.3 | 16,162.3 |
| Depreciation, % | 24.41 | 23.04 | 22.26 | 21.69 | 19.88 | 22.25 | 22.25 | 22.25 | 22.25 | 22.25 |
| EBIT | -5,451.0 | 9,432.0 | 8,945.0 | 9,606.0 | -6,432.0 | 3,659.9 | 3,971.0 | 4,308.5 | 4,674.6 | 5,071.9 |
| EBIT, % | -12.82 | 20.33 | 19.38 | 21.34 | -13.32 | 6.98 | 6.98 | 6.98 | 6.98 | 6.98 |
| Total Cash | 16,450.0 | 17,221.0 | 9,253.0 | 12,280.0 | 10,859.0 | 15,263.4 | 16,560.7 | 17,968.2 | 19,495.3 | 21,152.2 |
| Total Cash, percent | .0 | .0 | .0 | .0 | .0 | .0 | .0 | .0 | .0 | .0 |
| Account Receivables | 10,554.0 | 12,516.0 | 13,937.0 | 15,264.0 | 14,424.0 | 15,279.0 | 16,577.5 | 17,986.5 | 19,515.2 | 21,173.8 |
| Account Receivables, % | 24.82 | 26.98 | 30.19 | 33.92 | 29.86 | 29.16 | 29.16 | 29.16 | 29.16 | 29.16 |
| Inventories | 2,074.0 | 2,095.0 | 2,339.0 | 2,662.0 | 2,557.0 | 2,690.5 | 2,919.2 | 3,167.3 | 3,436.5 | 3,728.6 |
| Inventories, % | 4.88 | 4.52 | 5.07 | 5.91 | 5.29 | 5.13 | 5.13 | 5.13 | 5.13 | 5.13 |
| Accounts Payable | 2,713.0 | 2,949.0 | 3,040.0 | 3,259.0 | 3,602.0 | 3,566.0 | 3,869.1 | 4,197.9 | 4,554.7 | 4,941.8 |
| Accounts Payable, % | 6.38 | 6.36 | 6.59 | 7.24 | 7.46 | 6.8 | 6.8 | 6.8 | 6.8 | 6.8 |
| Capital Expenditure | -753.0 | -973.0 | -1,118.0 | -1,209.0 | -1,248.0 | -1,211.7 | -1,314.7 | -1,426.4 | -1,547.6 | -1,679.2 |
| Capital Expenditure, % | -1.77 | -2.1 | -2.42 | -2.69 | -2.58 | -2.31 | -2.31 | -2.31 | -2.31 | -2.31 |
| Tax Rate, % | -6.79 | -6.79 | -6.79 | -6.79 | -6.79 | -6.79 | -6.79 | -6.79 | -6.79 | -6.79 |
| EBITAT | -7,136.0 | 8,146.1 | 7,337.6 | 9,133.7 | -6,868.8 | 3,392.6 | 3,680.9 | 3,993.8 | 4,333.2 | 4,701.5 |
| Depreciation | ||||||||||
| Changes in Account Receivables | ||||||||||
| Changes in Inventories | ||||||||||
| Changes in Accounts Payable | ||||||||||
| Capital Expenditure | ||||||||||
| UFCF | -7,424.0 | 16,112.1 | 14,921.6 | 16,253.7 | 2,771.2 | 12,819.1 | 13,796.0 | 14,968.6 | 16,240.7 | 17,621.1 |
| WACC, % | 4.79 | 4.61 | 4.55 | 4.73 | 4.79 | 4.69 | 4.69 | 4.69 | 4.69 | 4.69 |
| PV UFCF | ||||||||||
| SUM PV UFCF | 65,405.6 | |||||||||
| Long Term Growth Rate, % | 2.00 | |||||||||
| Free cash flow (T + 1) | 17,973 | |||||||||
| Terminal Value | 667,521 | |||||||||
| Present Terminal Value | 530,745 | |||||||||
| Enterprise Value | 596,151 | |||||||||
| Net Debt | 40,854 | |||||||||
| Equity Value | 555,297 | |||||||||
| Diluted Shares Outstanding, MM | 2,027 | |||||||||
| Equity Value Per Share | 273.95 |
What You Will Receive
- Genuine Bristol-Myers Squibb Data: Preloaded financial metrics – encompassing revenue to EBIT – derived from real and projected figures.
- Complete Customization: Modify all key parameters (yellow cells) such as WACC, growth %, and tax rates.
- Immediate Valuation Adjustments: Automatic recalculations to assess the effects of changes on Bristol-Myers Squibb's fair value.
- Dynamic Excel Template: Designed for effortless edits, scenario analysis, and comprehensive projections.
- Efficient and Precise: Avoid the hassle of creating models from scratch while ensuring accuracy and adaptability.
Key Features
- Accurate Financial Data for Bristol-Myers Squibb: Gain access to reliable pre-loaded historical figures and future forecasts.
- Adjustable Forecast Assumptions: Modify the highlighted cells, such as WACC, growth rates, and profit margins.
- Real-Time Calculations: Instant updates to DCF, Net Present Value (NPV), and cash flow analysis.
- User-Friendly Dashboard: Clear charts and summaries to help you visualize your valuation outcomes.
- Designed for All Levels: An easy-to-navigate format suited for investors, CFOs, and consultants alike.
How It Functions
- Step 1: Download the Excel spreadsheet.
- Step 2: Examine the pre-filled data for Bristol-Myers Squibb Company (CELG-RI), including historical and forecasted figures.
- Step 3: Modify the key assumptions (highlighted in yellow) according to your insights.
- Step 4: Observe the automatic updates for Bristol-Myers Squibb's intrinsic value calculations.
- Step 5: Utilize the results for making informed investment choices or for reporting purposes.
Why Opt for This Calculator?
- User-Friendly and Accessible: Perfect for both novice and experienced users.
- Customizable Parameters: Effortlessly adjust inputs to suit your analytical needs.
- Real-Time Updates: Watch Bristol-Myers Squibb's valuation change instantly as you tweak inputs.
- Pre-Configured: Comes preloaded with Bristol-Myers Squibb's actual financial data for swift evaluations.
- Relied on by Experts: Trusted by investors and analysts for making well-informed choices.
Who Should Utilize This Product?
- Institutional Investors: Develop comprehensive and trustworthy valuation models for portfolio assessments related to Bristol-Myers Squibb Company (CELG-RI).
- Corporate Finance Departments: Evaluate valuation scenarios to inform strategic decision-making within the organization.
- Financial Consultants and Advisors: Deliver precise valuation insights for clients focused on Bristol-Myers Squibb Company (CELG-RI).
- Students and Educators: Leverage real-world data to enhance learning and practice in financial modeling.
- Pharmaceutical Enthusiasts: Gain insights into how companies like Bristol-Myers Squibb are valued in the healthcare market.
Contents of the Template
- Operating and Balance Sheet Data: Pre-filled historical data and forecasts for Bristol-Myers Squibb Company (CELG-RI), including metrics such as revenue, EBITDA, EBIT, and capital expenditures.
- WACC Calculation: A dedicated sheet for calculating the Weighted Average Cost of Capital (WACC), featuring parameters like Beta, risk-free rate, and share price.
- DCF Valuation (Unlevered and Levered): Customizable Discounted Cash Flow models that provide intrinsic value estimates along with detailed calculations.
- Financial Statements: Pre-loaded annual and quarterly financial statements to facilitate comprehensive analysis.
- Key Ratios: Contains profitability, leverage, and efficiency ratios specific to Bristol-Myers Squibb Company (CELG-RI).
- Dashboard and Charts: Visual representations of valuation outputs and underlying assumptions for easy analysis of results.
Disclaimer
All information, articles, and product details provided on this website are for general informational and educational purposes only. We do not claim any ownership over, nor do we intend to infringe upon, any trademarks, copyrights, logos, brand names, or other intellectual property mentioned or depicted on this site. Such intellectual property remains the property of its respective owners, and any references here are made solely for identification or informational purposes, without implying any affiliation, endorsement, or partnership.
We make no representations or warranties, express or implied, regarding the accuracy, completeness, or suitability of any content or products presented. Nothing on this website should be construed as legal, tax, investment, financial, medical, or other professional advice. In addition, no part of this site—including articles or product references—constitutes a solicitation, recommendation, endorsement, advertisement, or offer to buy or sell any securities, franchises, or other financial instruments, particularly in jurisdictions where such activity would be unlawful.
All content is of a general nature and may not address the specific circumstances of any individual or entity. It is not a substitute for professional advice or services. Any actions you take based on the information provided here are strictly at your own risk. You accept full responsibility for any decisions or outcomes arising from your use of this website and agree to release us from any liability in connection with your use of, or reliance upon, the content or products found herein.