
|
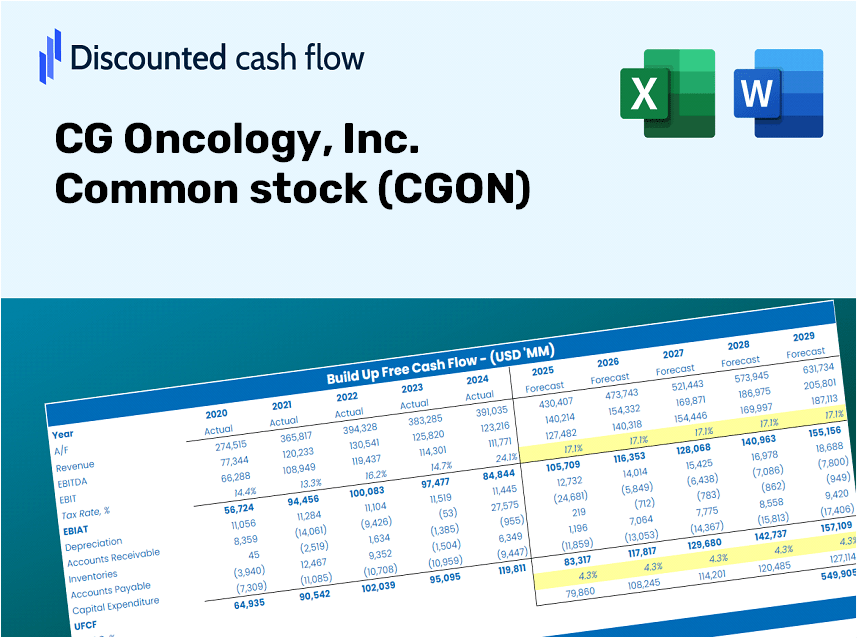
CG Oncology, Inc. Common stock (CGON) DCF Valuation |
Fully Editable: Tailor To Your Needs In Excel Or Sheets
Professional Design: Trusted, Industry-Standard Templates
Investor-Approved Valuation Models
MAC/PC Compatible, Fully Unlocked
No Expertise Is Needed; Easy To Follow
CG Oncology, Inc. Common stock (CGON) Bundle
Enhance your investment strategies with the CG Oncology, Inc. (CGON) DCF Calculator! Get real financial data for CG Oncology, adjust growth predictions and expenses, and instantly observe how these changes affect the intrinsic value of CG Oncology, Inc. (CGON).
What You Will Receive
- Flexible Forecast Inputs: Modify assumptions (growth %, margins, WACC) effortlessly to generate various scenarios.
- Real-World Financial Data: Pre-filled financial information for CG Oncology, Inc. to facilitate your analysis.
- Automatic DCF Calculations: The template computes Net Present Value (NPV) and intrinsic value automatically.
- Customizable and Professional Design: A sophisticated Excel model tailored to meet your valuation requirements.
- Designed for Analysts and Investors: Perfect for assessing projections, confirming strategies, and maximizing efficiency.
Key Features
- 🔍 Real-Life CG Oncology Financials: Pre-filled historical and projected data for CG Oncology, Inc. (CGON).
- ✏️ Fully Customizable Inputs: Adjust all critical parameters (yellow cells) such as WACC, growth %, and tax rates.
- 📊 Professional DCF Valuation: Built-in formulas calculate CG Oncology’s intrinsic value using the Discounted Cash Flow method.
- ⚡ Instant Results: Visualize CG Oncology’s valuation instantly after making adjustments.
- Scenario Analysis: Test and compare outcomes for various financial assumptions side-by-side.
How It Operates
- Download the Template: Gain immediate access to the Excel-based CG Oncology (CGON) DCF Calculator.
- Input Your Assumptions: Modify the yellow-highlighted cells for growth rates, WACC, margins, and more.
- Instant Calculations: The model automatically computes the intrinsic value of CG Oncology.
- Test Scenarios: Experiment with different assumptions to see how potential valuations may change.
- Analyze and Decide: Utilize the results to inform your investment strategy or financial analysis.
Why Choose CG Oncology's Calculator?
- Save Time: Skip the hassle of building a DCF model from the ground up – our tool is ready to go.
- Enhance Accuracy: Dependable financial data and formulas help minimize valuation errors.
- Fully Customizable: Adjust the model to suit your specific assumptions and forecasts.
- Easy to Understand: Intuitive charts and outputs simplify result analysis.
- Endorsed by Professionals: Created for experts who prioritize precision and functionality.
Who Should Use This Product?
- Institutional Investors: Develop comprehensive and trustworthy valuation models for analyzing CG Oncology, Inc. (CGON) investments.
- Corporate Finance Departments: Evaluate valuation scenarios to inform strategic decisions within the organization.
- Financial Consultants and Advisors: Offer clients precise valuation assessments for CG Oncology, Inc. (CGON) stock.
- Students and Educators: Utilize real-world data for practical exercises and instruction in financial modeling.
- Biotech Enthusiasts: Gain insights into the valuation of biotech companies like CG Oncology, Inc. (CGON) in the market.
Contents of the Template
- In-depth DCF Model: An editable template featuring comprehensive valuation calculations.
- Relevant Data: CG Oncology’s historical and projected financial figures loaded for easy analysis.
- Adjustable Parameters: Modify WACC, growth rates, and tax assumptions to explore different scenarios.
- Financial Statements: Complete annual and quarterly breakdowns for enhanced insights.
- Essential Ratios: Integrated analysis for profitability, efficiency, and leverage metrics.
- Interactive Dashboard: Visual charts and tables presenting clear, actionable results.
Disclaimer
All information, articles, and product details provided on this website are for general informational and educational purposes only. We do not claim any ownership over, nor do we intend to infringe upon, any trademarks, copyrights, logos, brand names, or other intellectual property mentioned or depicted on this site. Such intellectual property remains the property of its respective owners, and any references here are made solely for identification or informational purposes, without implying any affiliation, endorsement, or partnership.
We make no representations or warranties, express or implied, regarding the accuracy, completeness, or suitability of any content or products presented. Nothing on this website should be construed as legal, tax, investment, financial, medical, or other professional advice. In addition, no part of this site—including articles or product references—constitutes a solicitation, recommendation, endorsement, advertisement, or offer to buy or sell any securities, franchises, or other financial instruments, particularly in jurisdictions where such activity would be unlawful.
All content is of a general nature and may not address the specific circumstances of any individual or entity. It is not a substitute for professional advice or services. Any actions you take based on the information provided here are strictly at your own risk. You accept full responsibility for any decisions or outcomes arising from your use of this website and agree to release us from any liability in connection with your use of, or reliance upon, the content or products found herein.