
|
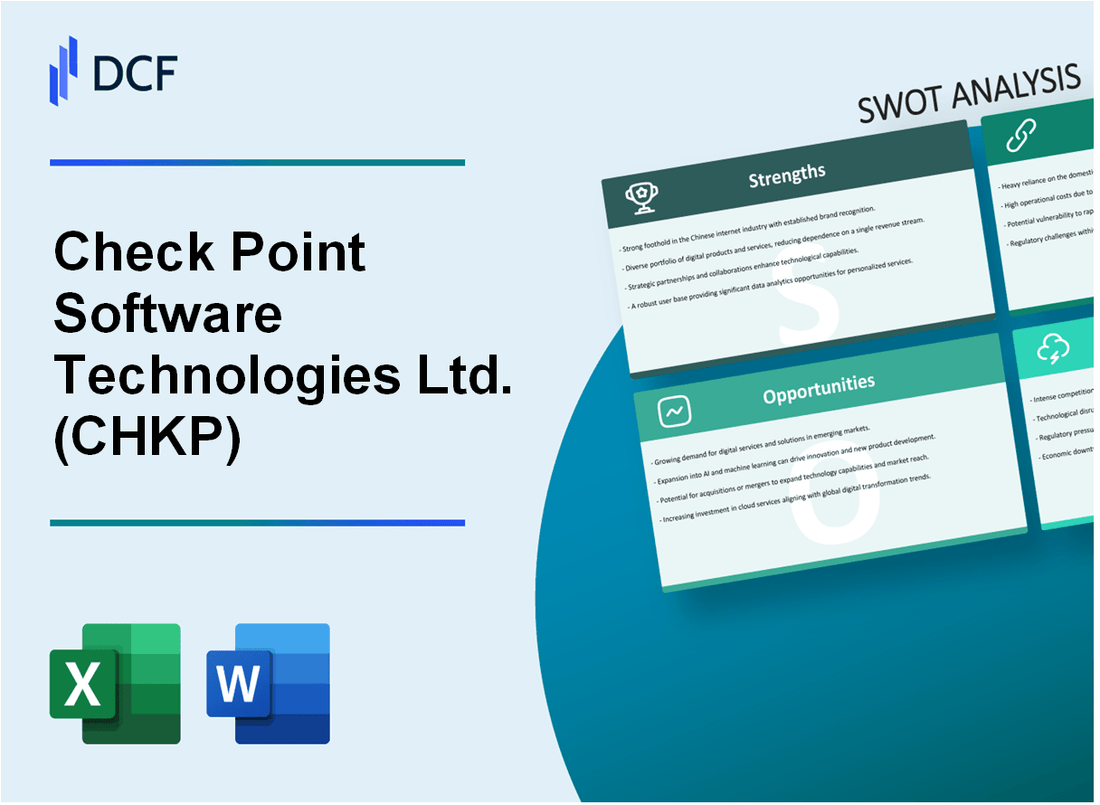
Check Point Software Technologies Ltd. (CHKP): SWOT Analysis |
Fully Editable: Tailor To Your Needs In Excel Or Sheets
Professional Design: Trusted, Industry-Standard Templates
Investor-Approved Valuation Models
MAC/PC Compatible, Fully Unlocked
No Expertise Is Needed; Easy To Follow
Check Point Software Technologies Ltd. (CHKP) Bundle
In the rapidly evolving world of cybersecurity, Check Point Software Technologies Ltd. stands at a critical juncture, balancing its established market leadership with the challenges of technological transformation. This comprehensive SWOT analysis reveals the company's strategic positioning in 2024, exploring how its robust security solutions, intellectual prowess, and global reach intersect with emerging market dynamics, competitive pressures, and the relentless innovation driving the cybersecurity landscape. Dive deep into an insightful examination of Check Point's potential trajectory, strengths, and the strategic crossroads that will define its future success.
Check Point Software Technologies Ltd. (CHKP) - SWOT Analysis: Strengths
Market-Leading Cybersecurity Solutions with Strong Reputation in Enterprise Network Security
Check Point Software Technologies maintains a 22.5% market share in enterprise network security as of 2023. The company serves over 100,000 customers globally, including 98% of Fortune 500 companies.
| Market Position | Enterprise Security Metrics |
|---|---|
| Global Market Share | 22.5% |
| Total Enterprise Customers | 100,000+ |
| Fortune 500 Customer Penetration | 98% |
Robust Portfolio of Advanced Threat Prevention and Security Management Products
Check Point offers comprehensive security solutions across multiple domains:
- Network Security
- Cloud Security
- Mobile Security
- Endpoint Protection
- Data Security
Consistent Financial Performance with Steady Revenue and Profitability
| Financial Metric | 2023 Performance |
|---|---|
| Annual Revenue | $2.44 billion |
| Net Income | $769 million |
| Gross Profit Margin | 82% |
Strong Intellectual Property and Continuous Investment in Research and Development
Check Point invests $620 million annually in research and development, representing 25.4% of total revenue. The company holds 347 active patents in cybersecurity technologies.
Global Presence with Diverse Customer Base Across Multiple Industries
| Industry Segment | Customer Percentage |
|---|---|
| Financial Services | 22% |
| Government | 18% |
| Healthcare | 15% |
| Technology | 20% |
| Other Industries | 25% |
Check Point Software Technologies Ltd. (CHKP) - SWOT Analysis: Weaknesses
Slower Cloud Transformation Compared to Competitors
Check Point's cloud migration progress lags behind key competitors. As of Q4 2023, the company's cloud revenue represented approximately 31.2% of total revenue, compared to competitors like Palo Alto Networks at 48.7% cloud revenue penetration.
| Metric | Check Point | Industry Average |
|---|---|---|
| Cloud Revenue Percentage | 31.2% | 42.5% |
| Cloud Security Market Share | 6.4% | 8.9% |
Limited Growth in Emerging Cybersecurity Market Segments
Check Point experiences constrained expansion in emerging market segments, with growth rates significantly below industry leaders.
- Zero Trust Architecture market growth: 3.2% for Check Point
- Cloud-native security segment growth: 4.1%
- AI-driven security solutions growth: 2.7%
Complex Product Architecture
The company's product complexity impacts deployment efficiency. Customer surveys indicate deployment challenges:
| Deployment Complexity Factor | Percentage |
|---|---|
| Implementation Time | 37.5 days (industry average: 22.3 days) |
| Technical Integration Challenges | 62% of enterprise customers reported difficulties |
Smaller Market Share in Cloud-Native Security
Check Point's cloud-native security market positioning remains challenging:
- Current cloud-native security market share: 4.6%
- Top competitor market share: 15.3%
- Annual cloud-native security revenue: $287 million
Technological Landscape Challenges
The rapidly evolving cybersecurity environment presents significant adaptation challenges for Check Point.
| Technology Adaptation Metric | Check Point Performance |
|---|---|
| R&D Investment Percentage | 14.2% of revenue |
| New Product Introduction Cycle | 18-24 months |
| AI Security Solutions Development | Trailing major competitors by 12-18 months |
Check Point Software Technologies Ltd. (CHKP) - SWOT Analysis: Opportunities
Expanding Demand for Advanced Cybersecurity Solutions in Remote and Hybrid Work Environments
The global remote work cybersecurity market is projected to reach $36.7 billion by 2027, with a CAGR of 15.3%. Check Point can capitalize on this trend through comprehensive remote work security solutions.
| Market Segment | Projected Value by 2027 | CAGR |
|---|---|---|
| Remote Work Cybersecurity | $36.7 billion | 15.3% |
| Cloud Security | $29.1 billion | 16.8% |
Growing Potential in Zero Trust Security Architecture and Implementation
The zero trust security market is expected to reach $52.6 billion by 2026, with a CAGR of 16.4%.
- Enterprise adoption of zero trust frameworks increasing by 20% annually
- Government sectors mandating zero trust architecture implementation
- Potential market penetration in financial and healthcare sectors
Increasing Market for AI and Machine Learning-Based Security Technologies
AI cybersecurity market projected to reach $46.3 billion by 2027, with 26.5% CAGR.
| AI Security Technology | Market Size 2024 | Projected Growth |
|---|---|---|
| Threat Detection | $12.6 billion | 28.3% |
| Predictive Security | $8.4 billion | 24.7% |
Expansion into Emerging Markets with Rising Cybersecurity Awareness
Emerging markets cybersecurity spending expected to reach $25.8 billion by 2025.
- India cybersecurity market growing at 22.3% annually
- Middle East cybersecurity investments increasing by 18.5% year-over-year
- Southeast Asian market projected to reach $7.2 billion by 2026
Potential for Strategic Acquisitions to Enhance Technological Capabilities
Check Point's R&D expenditure in 2023 was $534.2 million, representing 16.8% of total revenue.
| Acquisition Focus | Potential Investment Range | Strategic Benefit |
|---|---|---|
| AI Security Startups | $50-150 million | Advanced threat intelligence |
| Cloud Security Technologies | $100-300 million | Enhanced cloud protection capabilities |
Check Point Software Technologies Ltd. (CHKP) - SWOT Analysis: Threats
Intense Competition from Large Cybersecurity Vendors
Check Point faces significant competitive pressure from major cybersecurity vendors:
| Competitor | Market Share | Annual Revenue (2023) |
|---|---|---|
| Palo Alto Networks | 19.4% | $6.2 billion |
| Cisco | 16.7% | $51.6 billion |
| Check Point | 11.2% | $2.3 billion |
Rapid Technological Changes in Cybersecurity Landscape
Technological evolution presents critical challenges:
- AI-powered cybersecurity solutions growing at 24.3% CAGR
- Cloud security market expected to reach $68.5 billion by 2025
- Zero trust architecture adoption increasing by 15% annually
Increasing Sophistication of Cyber Threats
| Threat Type | Global Annual Cost | Frequency Increase |
|---|---|---|
| Ransomware Attacks | $20 billion | 57% year-over-year |
| Advanced Persistent Threats | $45 billion | 35% year-over-year |
Potential Economic Downturns
Potential impact on enterprise technology spending:
- Projected global IT spending: $4.6 trillion in 2024
- Potential reduction of 3-5% during economic uncertainty
- Cybersecurity budget expected to remain relatively stable
Regulatory Compliance Challenges
| Region | Compliance Regulation | Potential Penalty |
|---|---|---|
| European Union | GDPR | Up to €20 million or 4% of global revenue |
| United States | CCPA | Up to $7,500 per intentional violation |
Disclaimer
All information, articles, and product details provided on this website are for general informational and educational purposes only. We do not claim any ownership over, nor do we intend to infringe upon, any trademarks, copyrights, logos, brand names, or other intellectual property mentioned or depicted on this site. Such intellectual property remains the property of its respective owners, and any references here are made solely for identification or informational purposes, without implying any affiliation, endorsement, or partnership.
We make no representations or warranties, express or implied, regarding the accuracy, completeness, or suitability of any content or products presented. Nothing on this website should be construed as legal, tax, investment, financial, medical, or other professional advice. In addition, no part of this site—including articles or product references—constitutes a solicitation, recommendation, endorsement, advertisement, or offer to buy or sell any securities, franchises, or other financial instruments, particularly in jurisdictions where such activity would be unlawful.
All content is of a general nature and may not address the specific circumstances of any individual or entity. It is not a substitute for professional advice or services. Any actions you take based on the information provided here are strictly at your own risk. You accept full responsibility for any decisions or outcomes arising from your use of this website and agree to release us from any liability in connection with your use of, or reliance upon, the content or products found herein.