
|
Cholamandalam Investment and Finance Company Limited (CHOLAFIN.NS) DCF Valuation |
Fully Editable: Tailor To Your Needs In Excel Or Sheets
Professional Design: Trusted, Industry-Standard Templates
Investor-Approved Valuation Models
MAC/PC Compatible, Fully Unlocked
No Expertise Is Needed; Easy To Follow
Cholamandalam Investment and Finance Company Limited (CHOLAFIN.NS) Bundle
Explore the financial potential of Cholamandalam Investment and Finance Company Limited (CHOLAFINNS) with our user-friendly DCF Calculator! Enter your projections for growth, profit margins, and expenses to determine the intrinsic value of Cholamandalam Investment and Finance Company Limited (CHOLAFINNS) and inform your investment decisions.
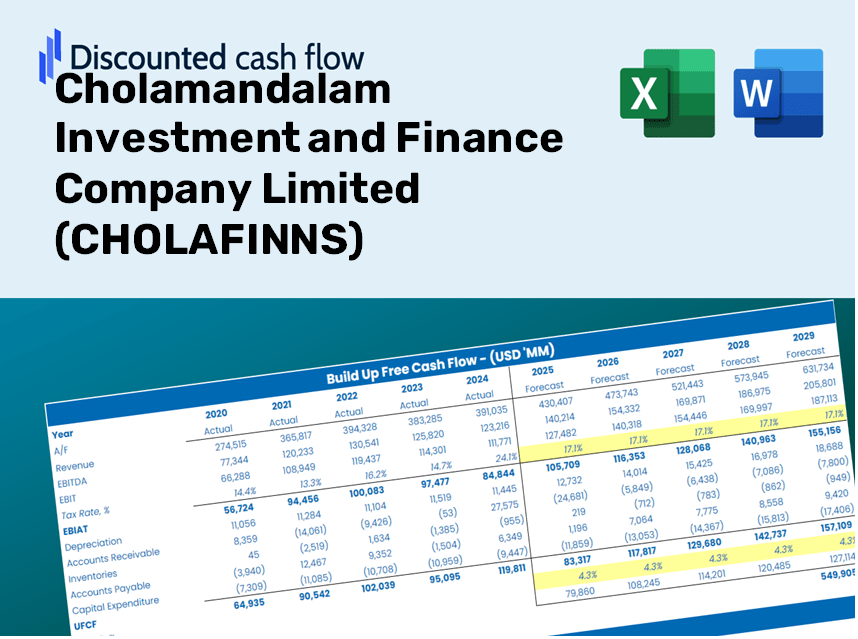
Discounted Cash Flow (DCF) - (USD MM)
| Year | AY1 2021 |
AY2 2022 |
AY3 2023 |
AY4 2024 |
AY5 2025 |
FY1 2026 |
FY2 2027 |
FY3 2028 |
FY4 2029 |
FY5 2030 |
|---|---|---|---|---|---|---|---|---|---|---|
| Revenue | 95,808.6 | 101,428.2 | 128,785.7 | 194,198.7 | 261,527.6 | 338,874.4 | 439,096.4 | 568,959.2 | 737,228.8 | 955,264.1 |
| Revenue Growth, % | 0 | 5.87 | 26.97 | 50.79 | 34.67 | 29.57 | 29.57 | 29.57 | 29.57 | 29.57 |
| EBITDA | 21,502.0 | 30,082.3 | 37,356.8 | 48,126.9 | 59,889.8 | 87,287.7 | 113,103.0 | 146,553.2 | 189,896.3 | 246,058.1 |
| EBITDA, % | 22.44 | 29.66 | 29.01 | 24.78 | 22.9 | 25.76 | 25.76 | 25.76 | 25.76 | 25.76 |
| Depreciation | 1,023.0 | 1,006.3 | 1,210.9 | 1,980.6 | 2,448.3 | 3,359.0 | 4,352.5 | 5,639.7 | 7,307.7 | 9,468.9 |
| Depreciation, % | 1.07 | 0.99213 | 0.94024 | 1.02 | 0.93615 | 0.99123 | 0.99123 | 0.99123 | 0.99123 | 0.99123 |
| EBIT | 20,479.0 | 29,076.0 | 36,145.9 | 46,146.3 | 57,441.5 | 83,928.6 | 108,750.5 | 140,913.5 | 182,588.6 | 236,589.2 |
| EBIT, % | 21.37 | 28.67 | 28.07 | 23.76 | 21.96 | 24.77 | 24.77 | 24.77 | 24.77 | 24.77 |
| Total Cash | 44,432.2 | 26,988.4 | 9,118.5 | 43,937.3 | 95,007.5 | 94,219.0 | 122,084.2 | 158,190.6 | 204,975.5 | 265,597.0 |
| Total Cash, percent | .0 | .0 | .0 | .0 | .0 | .0 | .0 | .0 | .0 | .0 |
| Account Receivables | 6,310.7 | 4,621.8 | 4,330.8 | 5,833.5 | 10,714.8 | 14,644.2 | 18,975.3 | 24,587.2 | 31,858.9 | 41,281.1 |
| Account Receivables, % | 6.59 | 4.56 | 3.36 | 3 | 4.1 | 4.32 | 4.32 | 4.32 | 4.32 | 4.32 |
| Inventories | .0 | 39,012.0 | 31,937.3 | .0 | .0 | 42,875.4 | 55,555.8 | 71,986.4 | 93,276.4 | 120,862.8 |
| Inventories, % | 0 | 38.46 | 24.8 | 0 | 0 | 12.65 | 12.65 | 12.65 | 12.65 | 12.65 |
| Accounts Payable | 985.9 | 1,275.9 | 1,716.1 | 2,956.9 | 2,369.4 | 4,099.1 | 5,311.4 | 6,882.2 | 8,917.7 | 11,555.0 |
| Accounts Payable, % | 1.03 | 1.26 | 1.33 | 1.52 | 0.90598 | 1.21 | 1.21 | 1.21 | 1.21 | 1.21 |
| Capital Expenditure | -328.9 | -959.1 | -1,767.4 | -10,762.4 | -1,995.3 | -6,076.8 | -7,874.0 | -10,202.7 | -13,220.2 | -17,130.1 |
| Capital Expenditure, % | -0.34329 | -0.9456 | -1.37 | -5.54 | -0.76294 | -1.79 | -1.79 | -1.79 | -1.79 | -1.79 |
| Tax Rate, % | 25.79 | 25.79 | 25.79 | 25.79 | 25.79 | 25.79 | 25.79 | 25.79 | 25.79 | 25.79 |
| EBITAT | 15,208.6 | 21,535.1 | 26,648.5 | 34,200.6 | 42,627.0 | 62,170.5 | 80,557.4 | 104,382.2 | 135,253.2 | 175,254.3 |
| Depreciation | ||||||||||
| Changes in Account Receivables | ||||||||||
| Changes in Inventories | ||||||||||
| Changes in Accounts Payable | ||||||||||
| Capital Expenditure | ||||||||||
| UFCF | 10,577.9 | -15,450.8 | 33,897.9 | 57,094.2 | 37,611.2 | 14,377.6 | 61,236.7 | 79,347.5 | 102,814.5 | 133,221.9 |
| WACC, % | 5.9 | 5.9 | 5.88 | 5.9 | 5.9 | 5.9 | 5.9 | 5.9 | 5.9 | 5.9 |
| PV UFCF | ||||||||||
| SUM PV UFCF | 316,789.7 | |||||||||
| Long Term Growth Rate, % | 2.00 | |||||||||
| Free cash flow (T + 1) | 135,886 | |||||||||
| Terminal Value | 3,486,767 | |||||||||
| Present Terminal Value | 2,618,186 | |||||||||
| Enterprise Value | 2,934,976 | |||||||||
| Net Debt | 1,655,353 | |||||||||
| Equity Value | 1,279,623 | |||||||||
| Diluted Shares Outstanding, MM | 842 | |||||||||
| Equity Value Per Share | 1,518.97 |
Benefits You Will Receive
- Authentic CHOLAFINNS Data: Comprehensive financials preloaded – covering everything from revenue to EBIT – based on real and projected metrics.
- Complete Customization: Modify essential parameters (highlighted cells) such as WACC, growth rates, and tax percentages.
- Immediate Valuation Adjustments: Automatic updates to reflect changes in CHOLAFINNS' fair value analysis.
- Flexible Excel Template: Designed for effortless modifications, scenario analysis, and in-depth forecasting.
- Efficient and Reliable: Eliminate the need to create models from the ground up while ensuring accuracy and adaptability.
Key Features
- Comprehensive DCF Calculator: Offers both detailed unlevered and levered DCF valuation models tailored for Cholamandalam Investment and Finance Company Limited (CHOLAFINNS).
- WACC Calculator: Features a pre-built Weighted Average Cost of Capital sheet with adjustable parameters for customized analysis.
- Customizable Forecast Assumptions: Easily alter growth rates, capital expenditures, and discount rates to suit your projections.
- Integrated Financial Ratios: Evaluate key profitability, leverage, and efficiency ratios specifically for Cholamandalam Investment and Finance Company Limited (CHOLAFINNS).
- User-Friendly Dashboard and Charts: Visual representations that encapsulate essential valuation metrics for straightforward analysis.
How It Functions
- Step 1: Download the Excel worksheet.
- Step 2: Review the pre-filled data for Cholamandalam Investment and Finance Company Limited (CHOLAFINNS) (CHOLAFINNS) including both historical and projected figures.
- Step 3: Modify key assumptions (highlighted in yellow) according to your analysis.
- Step 4: Observe the automatic recalculations reflecting Cholamandalam’s intrinsic value.
- Step 5: Utilize the results for your investment decisions or reporting needs.
Why Opt for Cholamandalam Investment and Finance Company Limited (CHOLAFINNS)?
- Save Time: Jump straight into your financial planning with our pre-built models.
- Enhance Accuracy: Our dependable financial data and calculations minimize valuation errors.
- Completely Customizable: Adjust the model to align with your unique assumptions and forecasts.
- User-Friendly: Intuitive charts and outputs simplify the analysis of your results.
- Endorsed by Professionals: Crafted for experts who prioritize accuracy and ease of use.
Who Should Use Cholamandalam Investment and Finance Company Limited (CHOLAFINNS)?
- Investors: Empower your investment choices with a top-tier valuation tool tailored for your needs.
- Financial Analysts: Enhance efficiency with a ready-to-use DCF model that you can easily customize.
- Consultants: Seamlessly modify the template for effective client presentations and reports.
- Finance Enthusiasts: Expand your knowledge of valuation methods through practical, real-life examples.
- Educators and Students: Utilize this resource as a hands-on learning aid in finance courses.
Overview of the Template Components
- Operating and Balance Sheet Data: Pre-filled historical data and forecasts for Cholamandalam Investment and Finance Company Limited (CHOLAFINNS), covering aspects such as revenue, EBITDA, EBIT, and capital expenditures.
- WACC Calculation: A dedicated worksheet for calculating the Weighted Average Cost of Capital (WACC), featuring parameters like Beta, risk-free rate, and share price.
- DCF Valuation (Unlevered and Levered): Customizable Discounted Cash Flow models that present intrinsic value along with detailed calculations.
- Financial Statements: Pre-loaded annual and quarterly financial statements to facilitate comprehensive analysis.
- Key Ratios: Incorporates profitability, leverage, and efficiency ratios relevant to Cholamandalam Investment and Finance Company Limited (CHOLAFINNS).
- Dashboard and Charts: Visual representations of valuation outputs and underlying assumptions for straightforward result analysis.
Disclaimer
All information, articles, and product details provided on this website are for general informational and educational purposes only. We do not claim any ownership over, nor do we intend to infringe upon, any trademarks, copyrights, logos, brand names, or other intellectual property mentioned or depicted on this site. Such intellectual property remains the property of its respective owners, and any references here are made solely for identification or informational purposes, without implying any affiliation, endorsement, or partnership.
We make no representations or warranties, express or implied, regarding the accuracy, completeness, or suitability of any content or products presented. Nothing on this website should be construed as legal, tax, investment, financial, medical, or other professional advice. In addition, no part of this site—including articles or product references—constitutes a solicitation, recommendation, endorsement, advertisement, or offer to buy or sell any securities, franchises, or other financial instruments, particularly in jurisdictions where such activity would be unlawful.
All content is of a general nature and may not address the specific circumstances of any individual or entity. It is not a substitute for professional advice or services. Any actions you take based on the information provided here are strictly at your own risk. You accept full responsibility for any decisions or outcomes arising from your use of this website and agree to release us from any liability in connection with your use of, or reliance upon, the content or products found herein.