
|
CKX Lands, Inc. (CKX) DCF Valuation |
Fully Editable: Tailor To Your Needs In Excel Or Sheets
Professional Design: Trusted, Industry-Standard Templates
Investor-Approved Valuation Models
MAC/PC Compatible, Fully Unlocked
No Expertise Is Needed; Easy To Follow
CKX Lands, Inc. (CKX) Bundle
Designed for accuracy, our (CKX) DCF Calculator empowers you to evaluate CKX Lands, Inc. valuation using real-world financial data, offering complete flexibility to modify all essential parameters for improved projections.
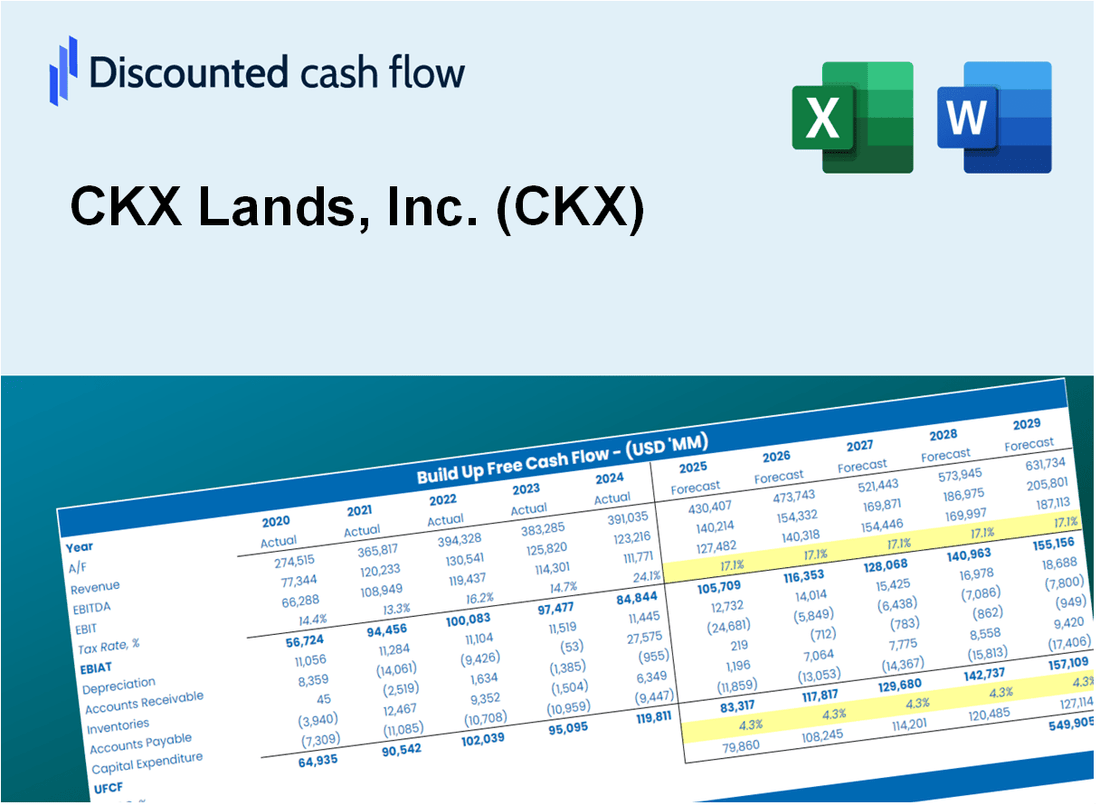
Discounted Cash Flow (DCF) - (USD MM)
| Year | AY1 2020 |
AY2 2021 |
AY3 2022 |
AY4 2023 |
AY5 2024 |
FY1 2025 |
FY2 2026 |
FY3 2027 |
FY4 2028 |
FY5 2029 |
|---|---|---|---|---|---|---|---|---|---|---|
| Revenue | .7 | .7 | 1.1 | 1.5 | 1.5 | 1.9 | 2.3 | 2.9 | 3.6 | 4.5 |
| Revenue Growth, % | 0 | 10.8 | 48.48 | 34.38 | 2.39 | 24.01 | 24.01 | 24.01 | 24.01 | 24.01 |
| EBITDA | .0 | .0 | -1.9 | .0 | .0 | -.3 | -.4 | -.5 | -.6 | -.8 |
| EBITDA, % | 4.13 | 5.39 | -167.85 | -1.56 | 2.35 | -17.94 | -17.94 | -17.94 | -17.94 | -17.94 |
| Depreciation | .0 | .0 | .0 | .0 | .0 | .0 | .0 | .0 | .0 | .0 |
| Depreciation, % | 0.48769 | 0.34786 | 0.53569 | 0.33293 | 0.2861 | 0.39805 | 0.39805 | 0.39805 | 0.39805 | 0.39805 |
| EBIT | .0 | .0 | -1.9 | .0 | .0 | -.3 | -.4 | -.5 | -.7 | -.8 |
| EBIT, % | 3.64 | 5.05 | -168.39 | -1.9 | 2.06 | -18.23 | -18.23 | -18.23 | -18.23 | -18.23 |
| Total Cash | 7.0 | 7.9 | 8.2 | 9.1 | 9.3 | 1.9 | 2.3 | 2.9 | 3.6 | 4.5 |
| Total Cash, percent | .0 | .0 | .0 | .0 | .0 | .0 | .0 | .0 | .0 | .0 |
| Account Receivables | .1 | .1 | .1 | .1 | .1 | .2 | .2 | .3 | .3 | .4 |
| Account Receivables, % | 14.66 | 6.81 | 11.44 | 7.05 | 5.14 | 9.02 | 9.02 | 9.02 | 9.02 | 9.02 |
| Inventories | .0 | .0 | .0 | .0 | .0 | .0 | .0 | .0 | .0 | .0 |
| Inventories, % | 0 | 0 | 0 | 0 | 0 | 0 | 0 | 0 | 0 | 0 |
| Accounts Payable | .1 | .1 | .0 | .2 | .1 | .2 | .2 | .3 | .4 | .4 |
| Accounts Payable, % | 16.49 | 14.92 | 3.4 | 10.71 | 3.45 | 9.8 | 9.8 | 9.8 | 9.8 | 9.8 |
| Capital Expenditure | .0 | .0 | .0 | .0 | .0 | .0 | .0 | .0 | -.1 | -.1 |
| Capital Expenditure, % | -1.39 | -3.04 | -2.65 | -1.4 | 0 | -1.7 | -1.7 | -1.7 | -1.7 | -1.7 |
| Tax Rate, % | 25.91 | 25.91 | 25.91 | 25.91 | 25.91 | 25.91 | 25.91 | 25.91 | 25.91 | 25.91 |
| EBITAT | .0 | .0 | -1.4 | .0 | .0 | -.2 | -.3 | -.4 | -.5 | -.6 |
| Depreciation | ||||||||||
| Changes in Account Receivables | ||||||||||
| Changes in Inventories | ||||||||||
| Changes in Accounts Payable | ||||||||||
| Capital Expenditure | ||||||||||
| UFCF | .0 | .1 | -1.5 | .1 | -.1 | -.2 | -.3 | -.4 | -.5 | -.6 |
| WACC, % | 4.68 | 4.68 | 4.68 | 4.68 | 4.68 | 4.68 | 4.68 | 4.68 | 4.68 | 4.68 |
| PV UFCF | ||||||||||
| SUM PV UFCF | -1.8 | |||||||||
| Long Term Growth Rate, % | 2.00 | |||||||||
| Free cash flow (T + 1) | -1 | |||||||||
| Terminal Value | -24 | |||||||||
| Present Terminal Value | -19 | |||||||||
| Enterprise Value | -21 | |||||||||
| Net Debt | -3 | |||||||||
| Equity Value | -17 | |||||||||
| Diluted Shares Outstanding, MM | 2 | |||||||||
| Equity Value Per Share | -8.35 |
What You Will Get
- Real CKX Financials: Access to historical and projected data for precise valuation.
- Customizable Inputs: Adjust WACC, tax rates, revenue growth, and capital expenditures as needed.
- Dynamic Calculations: Intrinsic value and NPV are computed in real-time.
- Scenario Analysis: Evaluate various scenarios to assess CKX Lands, Inc.'s future performance.
- User-Friendly Design: Designed for professionals while remaining approachable for newcomers.
Key Features
- Comprehensive CKX Financials: Gain access to precise pre-loaded historical data and future forecasts.
- Adjustable Forecast Parameters: Modify highlighted cells such as WACC, growth rates, and profit margins.
- Real-Time Calculations: Instant updates to DCF, Net Present Value (NPV), and cash flow assessments.
- User-Friendly Dashboard: Clear charts and summaries to help you visualize your valuation outcomes.
- Designed for All Skill Levels: An accessible and intuitive layout tailored for investors, CFOs, and consultants.
How It Works
- Step 1: Download the Excel file for CKX Lands, Inc. (CKX).
- Step 2: Review CKX's pre-filled financial data and forecasts.
- Step 3: Modify key inputs such as revenue growth, WACC, and tax rates (highlighted cells).
- Step 4: Observe the DCF model update in real-time as you adjust your assumptions.
- Step 5: Analyze the outputs and leverage the results for your investment strategies.
Why Choose This Calculator for CKX Lands, Inc. (CKX)?
- User-Friendly Interface: Perfectly crafted for both novices and seasoned professionals.
- Customizable Inputs: Adjust parameters to tailor your analysis of CKX's performance.
- Real-Time Feedback: Observe immediate changes in CKX's valuation as you modify inputs.
- Preloaded Data: Comes equipped with CKX's latest financial information for swift evaluations.
- Relied Upon by Experts: Favored by investors and analysts for making well-informed choices.
Who Should Use This Product?
- Investors: Evaluate CKX Lands, Inc.'s (CKX) market position before making investment decisions.
- CFOs and Financial Analysts: Optimize valuation methodologies and assess financial forecasts for CKX.
- Real Estate Developers: Understand how land valuation impacts project feasibility and funding.
- Consultants: Provide expert valuation insights and reports for real estate clients.
- Students and Educators: Utilize current data to learn and teach land valuation principles.
What the Template Contains
- Operating and Balance Sheet Data: Pre-filled CKX Lands, Inc. historical data and forecasts, including revenue, EBITDA, EBIT, and capital expenditures.
- WACC Calculation: A dedicated sheet for Weighted Average Cost of Capital (WACC), including parameters like Beta, risk-free rate, and share price.
- DCF Valuation (Unlevered and Levered): Editable Discounted Cash Flow models showing intrinsic value with detailed calculations.
- Financial Statements: Pre-loaded financial statements (annual and quarterly) to support analysis.
- Key Ratios: Includes profitability, leverage, and efficiency ratios for CKX Lands, Inc. (CKX).
- Dashboard and Charts: Visual summary of valuation outputs and assumptions to analyze results easily.
Disclaimer
All information, articles, and product details provided on this website are for general informational and educational purposes only. We do not claim any ownership over, nor do we intend to infringe upon, any trademarks, copyrights, logos, brand names, or other intellectual property mentioned or depicted on this site. Such intellectual property remains the property of its respective owners, and any references here are made solely for identification or informational purposes, without implying any affiliation, endorsement, or partnership.
We make no representations or warranties, express or implied, regarding the accuracy, completeness, or suitability of any content or products presented. Nothing on this website should be construed as legal, tax, investment, financial, medical, or other professional advice. In addition, no part of this site—including articles or product references—constitutes a solicitation, recommendation, endorsement, advertisement, or offer to buy or sell any securities, franchises, or other financial instruments, particularly in jurisdictions where such activity would be unlawful.
All content is of a general nature and may not address the specific circumstances of any individual or entity. It is not a substitute for professional advice or services. Any actions you take based on the information provided here are strictly at your own risk. You accept full responsibility for any decisions or outcomes arising from your use of this website and agree to release us from any liability in connection with your use of, or reliance upon, the content or products found herein.