
|
Clean Harbors, Inc. (CLH) DCF Valuation |
Fully Editable: Tailor To Your Needs In Excel Or Sheets
Professional Design: Trusted, Industry-Standard Templates
Investor-Approved Valuation Models
MAC/PC Compatible, Fully Unlocked
No Expertise Is Needed; Easy To Follow
Clean Harbors, Inc. (CLH) Bundle
Discover Clean Harbors, Inc.'s true value with our professional-grade DCF Calculator! Customize key assumptions, explore various scenarios, and assess how changes affect Clean Harbors, Inc. (CLH) valuation – all within a single Excel template.
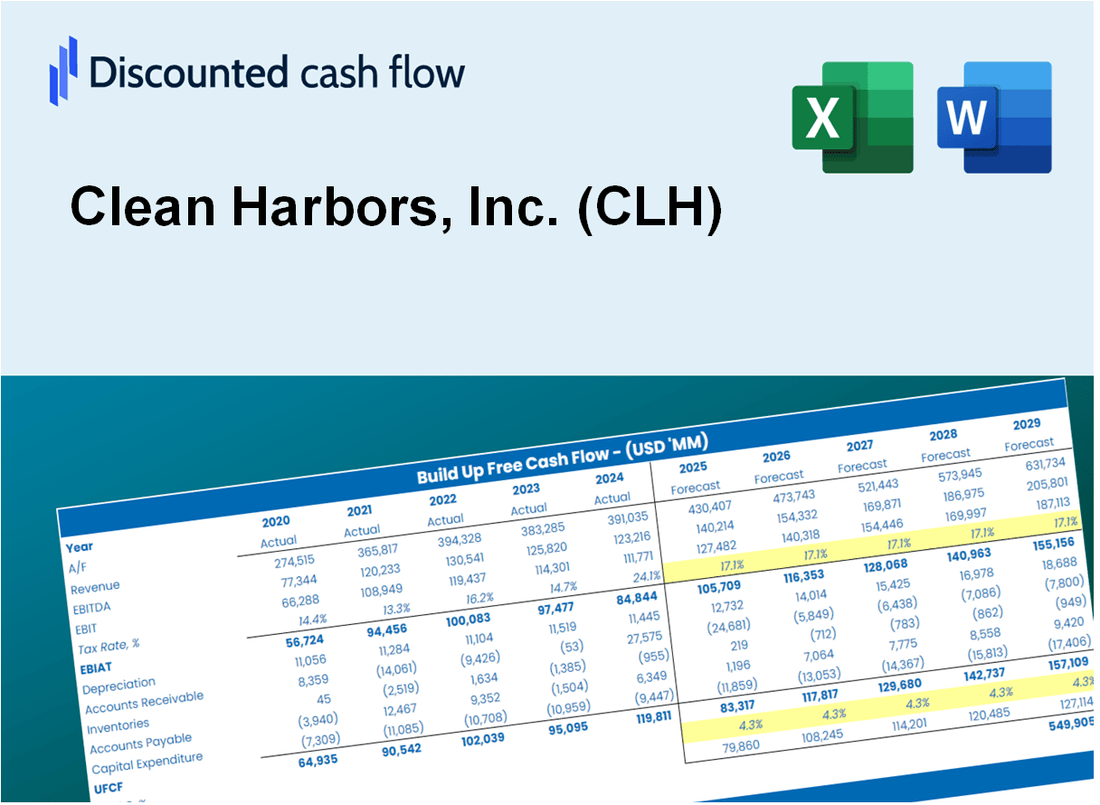
Discounted Cash Flow (DCF) - (USD MM)
| Year | AY1 2020 |
AY2 2021 |
AY3 2022 |
AY4 2023 |
AY5 2024 |
FY1 2025 |
FY2 2026 |
FY3 2027 |
FY4 2028 |
FY5 2029 |
|---|---|---|---|---|---|---|---|---|---|---|
| Revenue | 3,144.1 | 3,805.6 | 5,166.6 | 5,409.2 | 5,890.0 | 6,926.4 | 8,145.2 | 9,578.4 | 11,263.9 | 13,246.0 |
| Revenue Growth, % | 0 | 21.04 | 35.76 | 4.69 | 8.89 | 17.6 | 17.6 | 17.6 | 17.6 | 17.6 |
| EBITDA | 544.0 | 647.7 | 997.9 | 989.6 | 1,088.8 | 1,252.5 | 1,472.9 | 1,732.1 | 2,036.9 | 2,395.3 |
| EBITDA, % | 17.3 | 17.02 | 19.31 | 18.29 | 18.49 | 18.08 | 18.08 | 18.08 | 18.08 | 18.08 |
| Depreciation | 292.9 | 298.1 | 347.6 | 365.8 | 400.9 | 518.7 | 610.0 | 717.4 | 843.6 | 992.0 |
| Depreciation, % | 9.32 | 7.83 | 6.73 | 6.76 | 6.81 | 7.49 | 7.49 | 7.49 | 7.49 | 7.49 |
| EBIT | 251.1 | 349.6 | 650.3 | 623.8 | 687.8 | 733.8 | 862.9 | 1,014.7 | 1,193.3 | 1,403.3 |
| EBIT, % | 7.99 | 9.19 | 12.59 | 11.53 | 11.68 | 10.59 | 10.59 | 10.59 | 10.59 | 10.59 |
| Total Cash | 571.0 | 534.3 | 554.6 | 550.8 | 789.8 | 921.6 | 1,083.7 | 1,274.5 | 1,498.7 | 1,762.4 |
| Total Cash, percent | .0 | .0 | .0 | .0 | .0 | .0 | .0 | .0 | .0 | .0 |
| Account Receivables | 667.2 | 887.7 | 1,071.6 | 1,091.0 | 1,177.6 | 1,460.8 | 1,717.8 | 2,020.1 | 2,375.6 | 2,793.6 |
| Account Receivables, % | 21.22 | 23.33 | 20.74 | 20.17 | 19.99 | 21.09 | 21.09 | 21.09 | 21.09 | 21.09 |
| Inventories | 220.5 | 250.7 | 325.0 | 327.5 | 384.7 | 449.9 | 529.1 | 622.1 | 731.6 | 860.4 |
| Inventories, % | 7.01 | 6.59 | 6.29 | 6.05 | 6.53 | 6.5 | 6.5 | 6.5 | 6.5 | 6.5 |
| Accounts Payable | 195.9 | 359.9 | 446.6 | 451.8 | 487.3 | 567.4 | 667.2 | 784.6 | 922.7 | 1,085.0 |
| Accounts Payable, % | 6.23 | 9.46 | 8.64 | 8.35 | 8.27 | 8.19 | 8.19 | 8.19 | 8.19 | 8.19 |
| Capital Expenditure | -198.3 | -245.7 | -347.0 | -424.9 | -432.2 | -480.3 | -564.9 | -664.3 | -781.1 | -918.6 |
| Capital Expenditure, % | -6.31 | -6.46 | -6.72 | -7.86 | -7.34 | -6.93 | -6.93 | -6.93 | -6.93 | -6.93 |
| Tax Rate, % | 24.58 | 24.58 | 24.58 | 24.58 | 24.58 | 24.58 | 24.58 | 24.58 | 24.58 | 24.58 |
| EBITAT | 194.0 | 263.4 | 497.7 | 468.3 | 518.7 | 557.1 | 655.2 | 770.5 | 906.0 | 1,065.5 |
| Depreciation | ||||||||||
| Changes in Account Receivables | ||||||||||
| Changes in Inventories | ||||||||||
| Changes in Accounts Payable | ||||||||||
| Capital Expenditure | ||||||||||
| UFCF | -403.2 | 229.2 | 326.8 | 392.5 | 379.2 | 327.2 | 464.0 | 545.6 | 641.6 | 754.5 |
| WACC, % | 7.35 | 7.33 | 7.34 | 7.32 | 7.33 | 7.33 | 7.33 | 7.33 | 7.33 | 7.33 |
| PV UFCF | ||||||||||
| SUM PV UFCF | 2,161.9 | |||||||||
| Long Term Growth Rate, % | 2.00 | |||||||||
| Free cash flow (T + 1) | 770 | |||||||||
| Terminal Value | 14,431 | |||||||||
| Present Terminal Value | 10,131 | |||||||||
| Enterprise Value | 12,293 | |||||||||
| Net Debt | 2,354 | |||||||||
| Equity Value | 9,939 | |||||||||
| Diluted Shares Outstanding, MM | 54 | |||||||||
| Equity Value Per Share | 183.38 |
What You Will Get
- Pre-Filled Financial Model: Clean Harbors' actual data allows for accurate DCF valuation.
- Full Forecast Control: Modify revenue growth, margins, WACC, and other essential drivers.
- Instant Calculations: Automatic updates provide real-time results as you make adjustments.
- Investor-Ready Template: A polished Excel file crafted for professional-level valuation.
- Customizable and Reusable: Designed for versatility, enabling repeated use for comprehensive forecasts.
Key Features
- 🔍 Real-Life CLH Financials: Pre-filled historical and projected data for Clean Harbors, Inc.
- ✏️ Fully Customizable Inputs: Adjust all critical parameters (yellow cells) like WACC, growth %, and tax rates.
- 📊 Professional DCF Valuation: Built-in formulas calculate Clean Harbors’ intrinsic value using the Discounted Cash Flow method.
- ⚡ Instant Results: Visualize Clean Harbors’ valuation instantly after making changes.
- Scenario Analysis: Test and compare outcomes for various financial assumptions side-by-side.
How It Works
- Step 1: Download the prebuilt Excel template featuring Clean Harbors, Inc. (CLH) data.
- Step 2: Navigate through the pre-filled sheets to familiarize yourself with the essential metrics.
- Step 3: Modify forecasts and assumptions in the editable yellow cells (WACC, growth, margins).
- Step 4: Instantly see the recalculated results, including Clean Harbors, Inc. (CLH)'s intrinsic value.
- Step 5: Use the outputs to make informed investment decisions or create detailed reports.
Why Choose Clean Harbors, Inc. (CLH)?
- Environmental Impact: Committed to sustainable practices that protect our planet.
- Industry Expertise: Decades of experience in hazardous waste management and environmental services.
- Comprehensive Solutions: A wide range of services to meet all your environmental needs.
- Innovative Technology: Utilizing advanced technologies for efficient waste disposal and recycling.
- Proven Track Record: Trusted by numerous clients across various industries for reliability and effectiveness.
Who Should Use Clean Harbors, Inc. (CLH)?
- Environmental Science Students: Explore waste management practices and apply them in real-world scenarios.
- Researchers: Integrate industry-leading environmental models into studies or academic projects.
- Investors: Evaluate your investment strategies and analyze the financial performance of Clean Harbors, Inc. (CLH).
- Industry Analysts: Enhance your analysis with a comprehensive, customizable financial model specific to Clean Harbors, Inc. (CLH).
- Business Owners: Understand how environmental services companies like Clean Harbors, Inc. (CLH) operate and are valued.
What the Template Contains
- Comprehensive DCF Model: Editable template featuring detailed valuation calculations tailored for Clean Harbors, Inc. (CLH).
- Real-World Data: Clean Harbors’ historical and projected financials preloaded for in-depth analysis.
- Customizable Parameters: Modify WACC, growth rates, and tax assumptions to explore various scenarios.
- Financial Statements: Complete annual and quarterly breakdowns for enhanced insights into performance.
- Key Ratios: Integrated analysis for profitability, efficiency, and leverage specific to Clean Harbors, Inc. (CLH).
- Dashboard with Visual Outputs: Charts and tables designed for clear, actionable results related to Clean Harbors, Inc. (CLH).
Disclaimer
All information, articles, and product details provided on this website are for general informational and educational purposes only. We do not claim any ownership over, nor do we intend to infringe upon, any trademarks, copyrights, logos, brand names, or other intellectual property mentioned or depicted on this site. Such intellectual property remains the property of its respective owners, and any references here are made solely for identification or informational purposes, without implying any affiliation, endorsement, or partnership.
We make no representations or warranties, express or implied, regarding the accuracy, completeness, or suitability of any content or products presented. Nothing on this website should be construed as legal, tax, investment, financial, medical, or other professional advice. In addition, no part of this site—including articles or product references—constitutes a solicitation, recommendation, endorsement, advertisement, or offer to buy or sell any securities, franchises, or other financial instruments, particularly in jurisdictions where such activity would be unlawful.
All content is of a general nature and may not address the specific circumstances of any individual or entity. It is not a substitute for professional advice or services. Any actions you take based on the information provided here are strictly at your own risk. You accept full responsibility for any decisions or outcomes arising from your use of this website and agree to release us from any liability in connection with your use of, or reliance upon, the content or products found herein.