
|
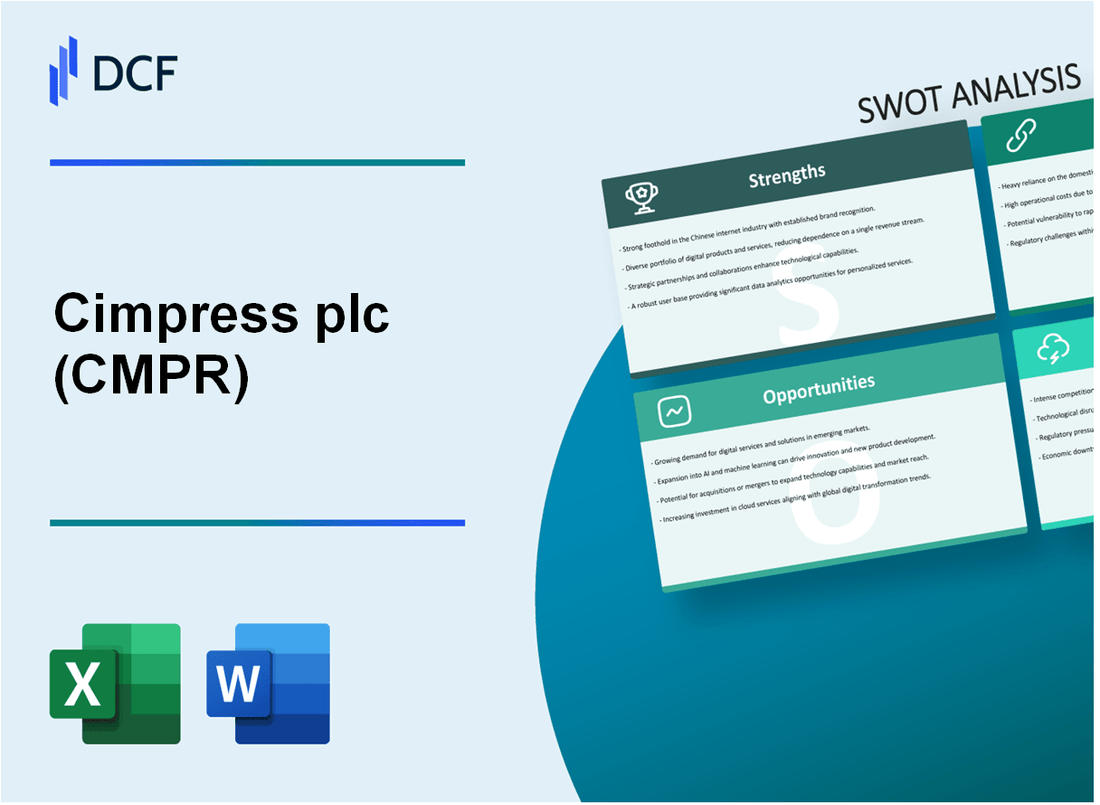
Cimpress plc (CMPR): SWOT Analysis [Nov-2025 Updated] |
Fully Editable: Tailor To Your Needs In Excel Or Sheets
Professional Design: Trusted, Industry-Standard Templates
Investor-Approved Valuation Models
MAC/PC Compatible, Fully Unlocked
No Expertise Is Needed; Easy To Follow
Cimpress plc (CMPR) Bundle
You're looking for a clear picture of Cimpress plc (CMPR) right now, and the 2025 fiscal year data tells a story of top-line growth masking a serious profit squeeze. The direct takeaway is this: Cimpress has a massive structural advantage in its production platform, enabling its flagship Vistaprint brand to generate over $1.8 billion in revenue, but the bottom line is buckling. Net Income plummeted 93% to just $12.9 million in FY2025, and high net leverage remains a concern at 3.1x trailing-twelve month EBITDA, so the big question is whether their strategic pivot to higher-value products can outrun the inflationary pressures killing their gross margin. We need to look past the total revenue of $3,403.1 million to see the real risks and opportunities.
Cimpress plc (CMPR) - SWOT Analysis: Strengths
Proprietary Mass Customization Platform Enables Efficient, Low-Cost Production
The core strength of Cimpress plc is its proprietary Mass Customization Platform (MCP), which is essentially a sophisticated, computer-integrated manufacturing system. This technology is what lets Cimpress do the impossible: produce highly personalized, one-off items at a cost and speed comparable to mass production.
The platform works by aggregating millions of small, individual orders from all its brands-like Vistaprint and PrintBrothers-and automatically batches them into large, high-volume production runs. This process drastically reduces setup costs, which is the biggest cost killer for traditional local print shops. It's a huge competitive advantage, allowing the company to offer affordable prices for unique products, from a single custom mug to a thousand branded pens.
- Aggregates small orders into high-volume production.
- Automatically routes jobs to optimize cost and delivery.
- Reduces setup costs for customized products.
- Enables economical customization in small quantities.
Flagship Vistaprint Brand Generated Over $1.8 Billion in FY2025 Revenue
Vistaprint is the clear revenue engine for Cimpress, showing remarkable resilience and growth even amidst broader economic uncertainty. For the full fiscal year 2025, Vistaprint generated a segment revenue of $1.821 billion. To be fair, this is more than half of the company's total consolidated revenue of approximately $3.403 billion for FY2025.
This flagship brand is a powerful, globally recognized entity that gives Cimpress a massive customer acquisition pipeline, especially among micro-businesses and individual consumers. The brand's revenue growth was a solid 5% for the year, showing that the customer base is sticky and the value proposition remains strong, even with a decline in legacy products like business cards. That's a huge foundation to build on.
Realized $15 Million in Incremental Gross Profit from Internal Business Synergies
The strategy of running a portfolio of businesses on a shared technology and fulfillment backbone is starting to pay off with measurable financial benefits. In FY2025, Cimpress reported achieving $15 million in incremental gross profit directly from cross-business synergies.
This synergy, often called cross-Cimpress fulfillment, means one brand's manufacturing facility can efficiently produce an order placed through another brand's website. For example, Vistaprint North America is now using fulfillment from National Pen and BuildASign for promotional products and signage, which helps Vistaprint become more competitive in those high-growth categories. Here's the quick math on segment revenue contribution for context:
| Cimpress Segment | FY2025 Revenue (Approx.) | Contribution to Synergy |
|---|---|---|
| Vista | $1.821 Billion | Major customer and product aggregator |
| PrintBrothers | $664.1 Million | European upload-and-print scale |
| The Print Group | $351.8 Million | Increased fulfillment for other businesses |
| National Pen | $374.8 Million | Source of promotional products fulfillment |
Strong Momentum in High-Growth Segments Like Promotional Products and Apparel
While legacy products like business cards face headwinds, Cimpress is defintely seeing strong momentum in higher-value, more complex product categories. These elevated products-including promotional products, apparel, signage, packaging, and labels-are driving organic growth.
The promotional products and apparel (PPAG) category is a significant strength, representing over 20% of the company's consolidated revenue. For Vistaprint specifically, these categories delivered double-digit growth in the third quarter of FY2025, driven by both increased order volume and higher average order values. This shift toward higher-value products is crucial for improving the per-customer gross profit and lifetime value, even if it sometimes weighs on the overall gross margin percentage in the short term. The company is actively focusing on expanding its product line here, adding new items like paper bags and drinkware.
Cimpress plc (CMPR) - SWOT Analysis: Weaknesses
You're looking for the clear risks in Cimpress plc's financial picture, and honestly, the weaknesses are centered on profitability and balance sheet structure. While the company is growing revenue, the capital structure and bottom-line performance show significant strain, which is a major red flag for any seasoned investor.
Net Income plummeted 93% to just $12.9 million in FY2025.
The most immediate and concerning weakness is the dramatic collapse in net income. For the full fiscal year ended June 30, 2025, Cimpress plc reported net income of just $12.9 million. This figure represents a staggering 93% year-over-year decline.
The core issue here wasn't just operations; it was driven by a $165.0 million decrease in net income, largely due to a massive $133.5 million increase in income tax expense. This increase came from a change in estimate to raise a valuation allowance in Switzerland, which is an accounting complexity, but it still crushed the reported earnings. This kind of volatility makes forecasting extremely difficult.
| Financial Metric (FY2025) | Value | Context of Weakness |
|---|---|---|
| Net Income | $12.9 million | 93% year-over-year decline, driven by high tax expense. |
| Adjusted EBITDA | $433.2 million | Decreased by $35.5 million year-over-year. |
| Adjusted Free Cash Flow | $148.0 million | Decreased by $113.0 million year-over-year. |
High net leverage remains at 3.1x trailing-twelve month EBITDA.
The debt load is a persistent weakness. As of June 30, 2025, the company's net leverage ratio stood at 3.1x trailing-twelve month (TTM) EBITDA. While this is down slightly from the 3.3x reported in Q3 FY2025, it's still above their long-term target of 2.5x.
Here's the quick math: high leverage means more cash is dedicated to servicing debt, which limits the capital available for growth investments or share repurchases. Cimpress plc is committed to reducing this, but until they hit that 2.5x target, the debt-to-EBITDA ratio will be a drag on valuation and a source of risk if profitability dips further.
Consolidated gross margin compressed to 47.5% for the full fiscal year.
The pressure on gross margin is real. For FY2025, the consolidated gross margin was 47.5%, a decline of 100 basis points compared to the prior year.
This compression isn't entirely a surprise, but it's defintely a weakness. It stems from a product mix shift toward higher-value categories that, paradoxically, have a lower gross margin percentage than some of their legacy products, like business cards. Also, external headwinds like tariffs continue to bite, impacting gross profit by about $3 million in Q4 FY2025 alone, mostly within the National Pen segment.
- Gross margin is pressured by product mix shift toward lower-margin, higher-growth categories.
- Tariff-related costs, net of pricing increases, impacted gross profit.
- The decline in legacy, high-margin products weighs on the consolidated figure.
Negative shareholders' equity reflects a complex balance sheet structure.
A look at the balance sheet reveals a structural weakness: Cimpress plc operates with a Shareholders' Deficit, which is the technical term for negative shareholders' equity. This is not uncommon for companies that have historically used significant debt or aggressive share repurchase programs, but it signals a complex, highly leveraged capital structure.
The negative Return on Equity (ROE) of 6.23% for the period is a direct reflection of this deficit. What this estimate hides is the underlying risk: if the company were to liquidate, the book value of assets would not cover all its liabilities. This structure limits financial flexibility and increases the perceived risk for conservative investors, even if the business is generating positive cash flow.
Cimpress plc (CMPR) - SWOT Analysis: Opportunities
Target a $100 Billion Addressable Market Still Dominated by Traditional, Slow Suppliers
You're sitting on a massive, fragmented market, and that's a huge opportunity. Cimpress plays in a total addressable market (TAM) for print and promotional products across North America, Europe, and Australia that is estimated to exceed $100 billion annually. To be fair, a lot of that is still stuck in the old-school, traditional print model-the one where you wait two weeks and pay too much.
The key here is that more than 60% of this massive market is still served by those traditional, slower suppliers. Cimpress's web-to-print mass customization platform (MCP) is designed to disrupt that. Our current market share in the high-growth categories like packaging and signage remains low, so the runway for growth is defintely long. We just need to keep chipping away at that traditional share.
Accelerate Pivot to Elevated Products Like Packaging and Signage for Higher Customer Value
The shift to 'elevated products' is not just a buzzword; it's a clear path to higher customer lifetime value. These products-like packaging, signage, and promotional items-are what businesses value more highly than our legacy products, like business cards. The financial impact is already visible in our fiscal year 2025 results.
Consolidated revenue for FY2025 grew to $3,403.1 million, and the growth engine was clearly these elevated categories. Vista, our largest segment, saw the most significant growth in Promotional Products and Apparel (PPAG) and signage, contributing $81.5 million in incremental revenue for the year. The best part? These categories are attracting higher-value customers who spend more. Here's the quick math on new customer growth in these key areas:
| Elevated Product Category (Vista) | New Customer Growth (YoY, FY2025) | Growth Status (Q3 FY2025) |
|---|---|---|
| Packaging | 29% | Double-digit growth |
| Signage | 7% | Double-digit growth |
| Promotional Products & Apparel (PPAG) | 3% | Double-digit growth |
Technology Replatforming Investments Expected to Drive Material Benefits by FY2027
We've been investing heavily in the foundation-our technology replatforming-and now it's time to see the payoff. The Mass Customization Platform (MCP) is being refreshed to be all new, modern, API-driven, cloud-based, and AI-ready. This isn't just an IT project; it's a core operational efficiency driver.
The initial benefits are already showing up: Cimpress reported $15 million in incremental gross profit from cross-business synergies in FY2025, largely thanks to these initiatives, like the cross-Cimpress fulfillment program. We are planning elevated capital expenditures in FY2026 specifically to accelerate this work, and management expects these investments to drive material financial benefits starting by FY2027. This replatforming will reduce costs, speed up new product introductions, and personalize the customer experience better than ever.
Expand Same-Day and Next-Day Delivery Capabilities to Improve Customer Experience
In e-commerce, speed is money. Customers expect instant gratification, and our competitors, like Amazon and Walmart, are setting an incredibly high bar for fast delivery. We need to meet that expectation, and we are investing in same-day and next-day delivery capabilities across our network.
This focus on faster turnaround is a direct way to improve the customer experience and reduce the risk of customer churn (customer attrition). It's a critical part of our strategy to capture more of the small business wallet share.
- Invest in logistics to cut delivery times.
- Accelerate product introductions through cross-Cimpress fulfillment.
- Improve customer service with faster delivery options.
This investment in speed, coupled with the new Pixartprinting U.S. facility coming online, will help us deliver the full range of elevated products with the convenience and speed that small business customers demand. The faster we deliver, the more they buy. It's that simple.
Cimpress plc (CMPR) - SWOT Analysis: Threats
You need to be clear-eyed about the external pressures Cimpress plc is facing. The core issue is that while total revenue hit $3,403.1 million in FY2025, the cost of scaling the new product lines and dealing with inflation is killing the bottom line. You need to watch that net leverage closely; they target 2.5x, but they are still at 3.1x. This higher debt load makes them more vulnerable to the threats I'm about to lay out.
Sustained input cost inflation is driving up internal variable manufacturing and shipping costs.
The biggest immediate threat to margin is the persistent inflation in raw materials and logistics. Cimpress operates a huge manufacturing network, and the cost of paper, ink, and energy has not stabilized. This isn't just a one-time hit; it's a sustained headwind. Here's the quick math: even a 3% rise in variable manufacturing costs across their $1.8 billion Cost of Revenue (estimated for FY2025) translates to an extra $54 million in expenses they have to absorb or pass on. Passing that on is tough when you're fighting for market share.
Shipping costs are also a major factor. The global logistics market is still volatile, and as an e-commerce player, they rely heavily on last-mile carriers. They have to manage this risk by diversifying carriers, but the cost per package is defintely rising.
Legacy products, like business cards, are experiencing declining market demand.
The market for traditional print products is shrinking, plain and simple. While Cimpress has diversified into signage, apparel, and promotional items, the legacy business-especially business cards-is a drag. The shift to digital networking and QR codes means fewer small businesses are ordering 500 cards at a time. This decline impacts the efficiency of their mass customization platform, which is built on high-volume, standardized jobs.
The decline in demand for these high-volume, low-margin products creates an overcapacity risk in their older printing facilities. They have to keep investing in new product lines just to offset the revenue erosion from the old ones. It's a treadmill.
Trade volatility and tariffs continue to pressure margins, especially in National Pen.
National Pen, which focuses on promotional products like branded pens and mugs, is particularly exposed to global trade friction. A significant portion of these goods is sourced from Asia and then customized in their facilities. Any new tariffs or supply chain disruptions directly increase the cost of goods sold (COGS) for this segment.
For instance, a 10% tariff hike on a key product category could wipe out a substantial chunk of National Pen's operating income, which is already under pressure from competition. The constant uncertainty makes long-term sourcing contracts a gamble. Here are the key areas of exposure:
- Source materials from China and other Asian markets.
- Currency fluctuations impacting import costs.
- Shipping delays due to port congestion or geopolitical issues.
Weakness in the macro-economy, particularly manufacturing and housing, pressures B2B demand.
Cimpress is a business-to-business (B2B) supplier, so its performance is tightly linked to the health of small and medium-sized businesses (SMBs). When the macro-economy slows, SMBs are the first to cut discretionary spending, and marketing materials are an easy target. The slowdown in the housing and manufacturing sectors-two major drivers of small business activity-is a clear warning sign.
Look at the historical correlation: a 1.5% dip in GDP growth often correlates to a 5-7% decline in new business formation, which is Cimpress's core customer base. This translates to lower order volumes and less frequent purchases. You can see this risk mapped out by segment:
| Cimpress Segment | Primary Macro-Economic Risk | Impact on Demand |
|---|---|---|
| Vistaprint | SMB Marketing/Discretionary Spend | Lower new customer acquisition, smaller order sizes. |
| National Pen | Corporate Gifting/Promotional Budgets | Delayed or canceled large-volume corporate orders. |
| Cimpress Technology/Others | Manufacturing/Industrial Output | Reduced demand for large-format signs and industrial print. |
The biggest threat here is that a recession doesn't just cut spending; it increases customer churn as businesses fail. That's a double whammy.
Disclaimer
All information, articles, and product details provided on this website are for general informational and educational purposes only. We do not claim any ownership over, nor do we intend to infringe upon, any trademarks, copyrights, logos, brand names, or other intellectual property mentioned or depicted on this site. Such intellectual property remains the property of its respective owners, and any references here are made solely for identification or informational purposes, without implying any affiliation, endorsement, or partnership.
We make no representations or warranties, express or implied, regarding the accuracy, completeness, or suitability of any content or products presented. Nothing on this website should be construed as legal, tax, investment, financial, medical, or other professional advice. In addition, no part of this site—including articles or product references—constitutes a solicitation, recommendation, endorsement, advertisement, or offer to buy or sell any securities, franchises, or other financial instruments, particularly in jurisdictions where such activity would be unlawful.
All content is of a general nature and may not address the specific circumstances of any individual or entity. It is not a substitute for professional advice or services. Any actions you take based on the information provided here are strictly at your own risk. You accept full responsibility for any decisions or outcomes arising from your use of this website and agree to release us from any liability in connection with your use of, or reliance upon, the content or products found herein.